Transformation is made one day at a time. Ideas, mistakes, doing and refining. Ship early, ship often. There are no ribbon cutting moments just the quiet satisfaction that a tool or way things are done become normal and it’s seen as business as usual. I love this transformation.
To counteract my nervous energy on my Dublin to New York City flight I made a brief list of things we’ve introduced in the recent past.
We’ve introduced new roles including Head of Digital and user researchers. New as in never been seen in the service before. How cool is that?! We’ve pushed as many decisions out from management as possible to keep the responsibility with whomever has the direct expertise and to release the bottleneck of waiting for the four of us. Yes we can still override a preferred course of direction.
We’re getting digital tools (basecamp and trello, emu) into position as THE way we do business – freeing up meeting time and being transparent. We’re also chipping away at a culture of being a ‘cultural business’. And that’s just on the staff front. All things to be super proud of from those across the team. What I love though is how “normal” all this is now. Tools like Basecamp were seen as for the nerds like me back in 2014 in the team. Yet in 2016 I can see we now use it for project managing all exhibitions as a matter of course.
We’re cooking on gas using google drive now too as the spreadsheet sharing and linking data gets more critical eg for kpi work. Accurate information over live/ancient information.
The public are seeing some of this work through our ‘Pay What You Think’ approach to our own in-house programme. Tinkering with pricing and value.
Stroll into Bristol Museum & Art Gallery and you’re now greeted upon entry and asked if you’d like to donate without delay.
All of the above are super closely aligned to our core value of “excellence” by focusing on the needs of the user – staff or public. You may be asked on your visit about any number of our services and we use this to make our service better.
Long live business as usual.
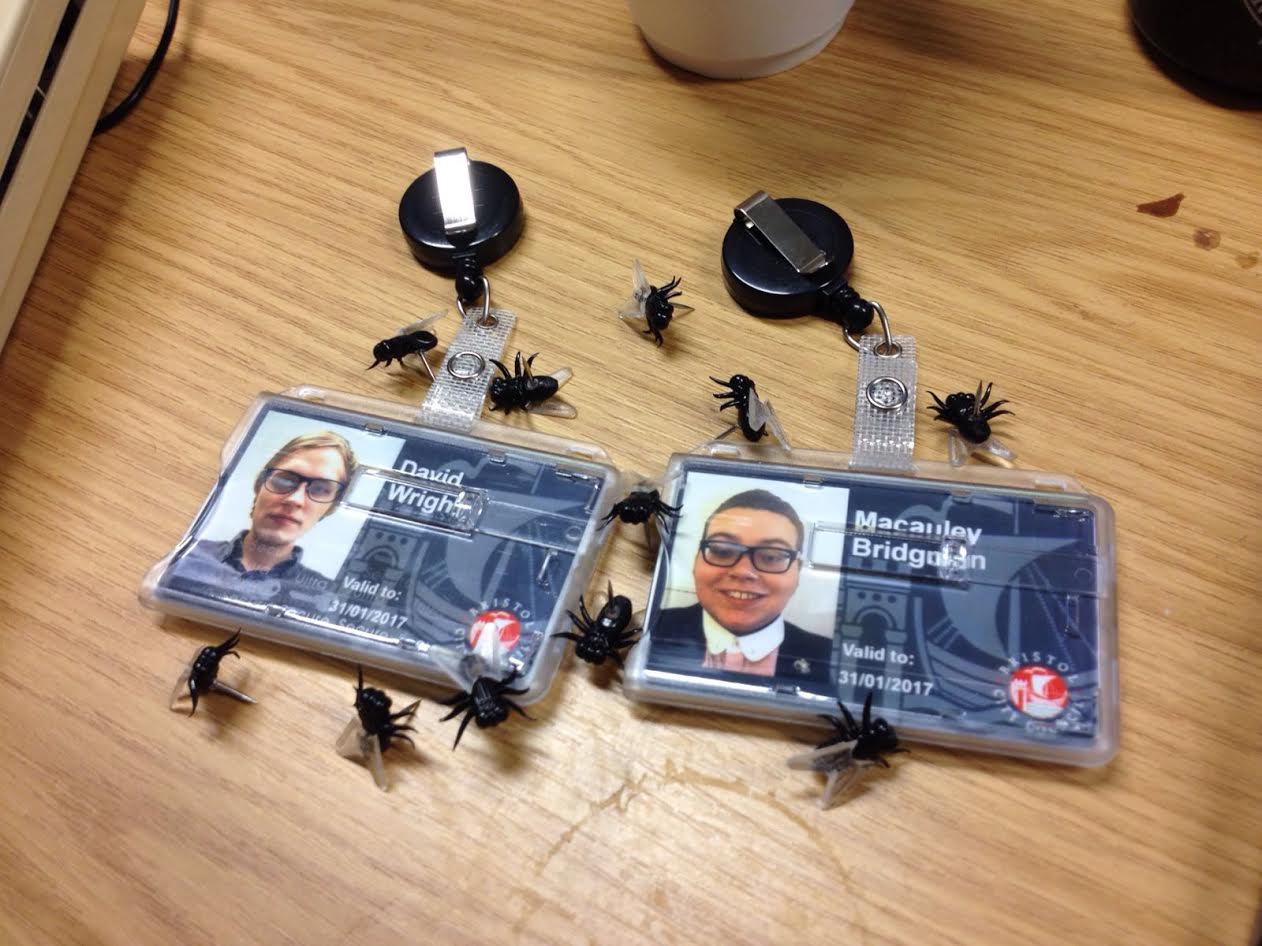
By David Wright (Digital Curating Intern, Bristol Culture)
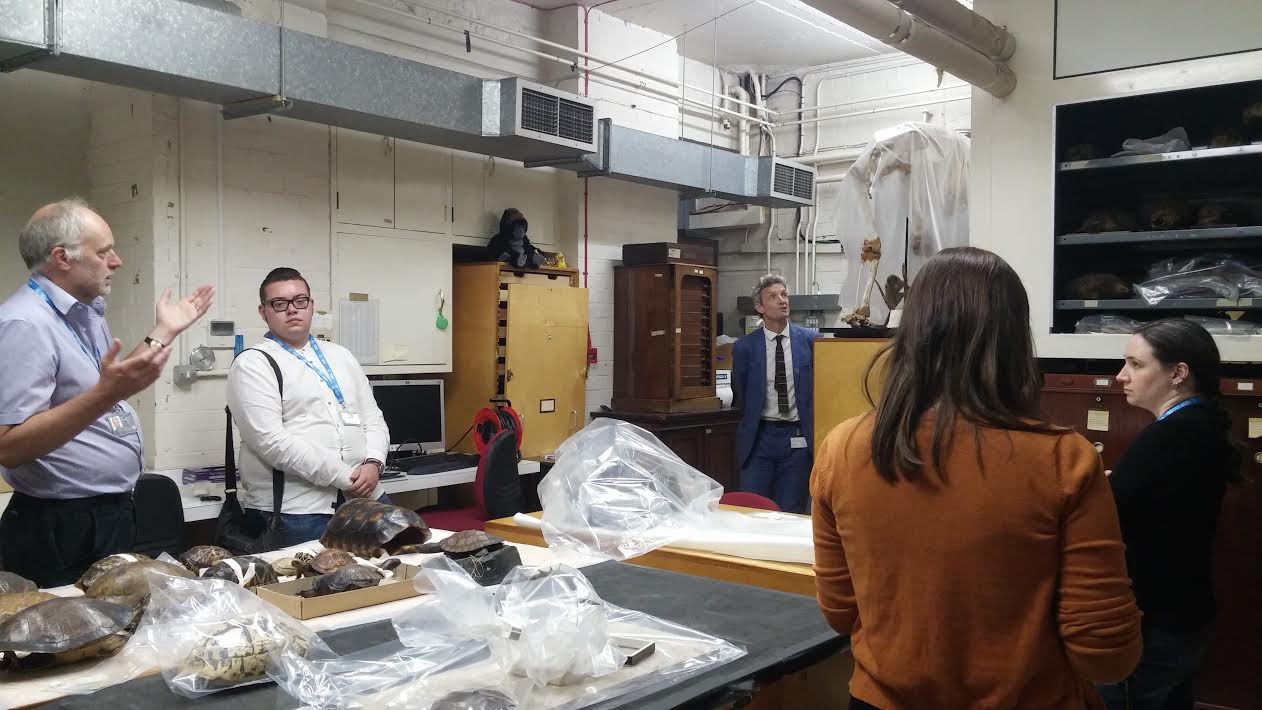
Both Macauley Bridgman and I are now into week six of our internship as Digital Curating Assistants here at Bristol Culture (Bristol Museums) . At this stage we have partaken in a wide array of projects which have provided us with invaluable experiences as History and Heritage students (a discipline that combines the study if history with its digital interpretation) at the University of the West of England. We have now been on several different tours of the museum both front of house and behind the scenes. Most notably our store tour with Head of Collections Ray Barnett, which provided us with knowledge of issues facing curators nationwide such as conservation techniques, museum pests and the different methods of both utilisation and presentation of objects within the entirety of the museum’s collection.
In addition we were also invited to a presentation by the International Training Programme in which Bristol Museums is a partner alongside the British Museum. Presentations given by Ntombovuyo Tywakadi, Collections Assistant at Ditsong Museum (South Africa), followed by Wanghuan Shi, Project Co-ordinator at Art Exhibitions China and Ana Sverko, Research Associate at the Institute of Art History (Croatia). All three visitors discussed their roles within their respective institutions and provided us with a unique insight into curating around the world. We both found these presentations both insightful and thought provoking as we entered Q&A centred on restrictions and limitations of historical presentation in different nations.
Alongside these experiences we have also assumed multiple projects for various departments around the museum as part of our cross disciplinary approach to digital curating.
Our first project involved working with Natural Sciences Collections Officer Bonnie Griffin to photograph, catalogue and conserve Natural History specimens in the store. This was a privileged assignment which we have perhaps found the most enjoyable. The first hand curating experience and intimate access with both highly experienced staff and noteworthy artefacts we both found inspiring in relation to our respective future careers.
David Wright – Digital Curating Intern
Following on from this we undertook a project assigned by Lisa Graves, Curator for World Cultures, to digitise the outdated card index system for India. The digital outcome of this will hopefully see use in an exhibition next year to celebrate the seventieth anniversary of Indian independence in a UK-India Year of Culture. At times we found this work to be somewhat tedious and frustrating however upon completion we have come to recognise the immense significance of digitising museum records for both the preservation of information for future generations and the increased potential such records provide for future utilisation and accessibility.
We have now fully immersed ourselves into our main Bristol Parks project which aims to explore processes by which the museum’s collections can be recorded and presented through geo-location technology. For the purposes of this project we have limited our exploration to well-known local parks, namely Clifton and Durdham Downs with the aim of creating a comprehensive catalogue of records that have been geo-referenced to precise sites within the area. With the proliferation of online mapping tools this is an important time for the museum to analyse how it records object provenance, and having mappable collections makes them suitable for inclusion in a variety of new and exciting platforms – watch this space!. Inclusive of this we have established standardised procedures for object georeferencing which can then be replicated for the use of future ventures and areas. Our previous projects for other departments have provided the foundation for us to explore and critically analyse contemporary processes and experiment with new ways to create links between objects within the museum’s collections.
As the saying goes “time flies when you are having fun”, and this is certainly true for our experience up to date. We are now in our final two weeks here at the museum and our focus is now fervently on completing our Bristol Parks project.
We are currently uni students at UWE (University of the West of England) studying history with heritage as the first students on this programme of study. We have been given the fantastic opportunity to work with the digital department at Bristol Culture which runs the various museums and heritage sites in and around Bristol as its first digital curating internship. These fully compliment what we have been and continue to study within our degrees and will allow us to put into practical use what we have studied.
Over the course of the next eight weeks will be working alongside various different departments, collections and projects, offering us a unique insight into the heritage industry.
What does digital curating mean to us?
For us digital curation is the future of 21st century museology the implementation and development of which allows for four significant benefits:
• Democratisation of information reduces barriers to entry.
• Increases the potential use of collections.
• Stimulates further research.
• Widens community engagement to ever greater and diverse audiences.
As fantastic as these systems can be there is still room for further advancement. We have already learnt in our short time here that a few issues include inconsistencies across departments, collection backlog, dirty data also the lack of secure data sharing detailed information between institutions. Despite these hurdles the drive to expand and improve digital curation continues with great hope for what can be achieved in this field.
Expectations for the role:
Through this role we aim to:
• Engage and critique existing cataloguing methods and SPECTRUM standard archival systems such as EMu.
• To develop strategies for increasing engagement with both collections and institutions.
• Develop the necessary skills and experience to pursue a career within the heritage industry.
• Work closely and network with a variety of different heritage professionals within the South West.
We both look forward to expanding both our knowledge and experience, as well as eagerly anticipating what this internship has in store for the next eight week’s .
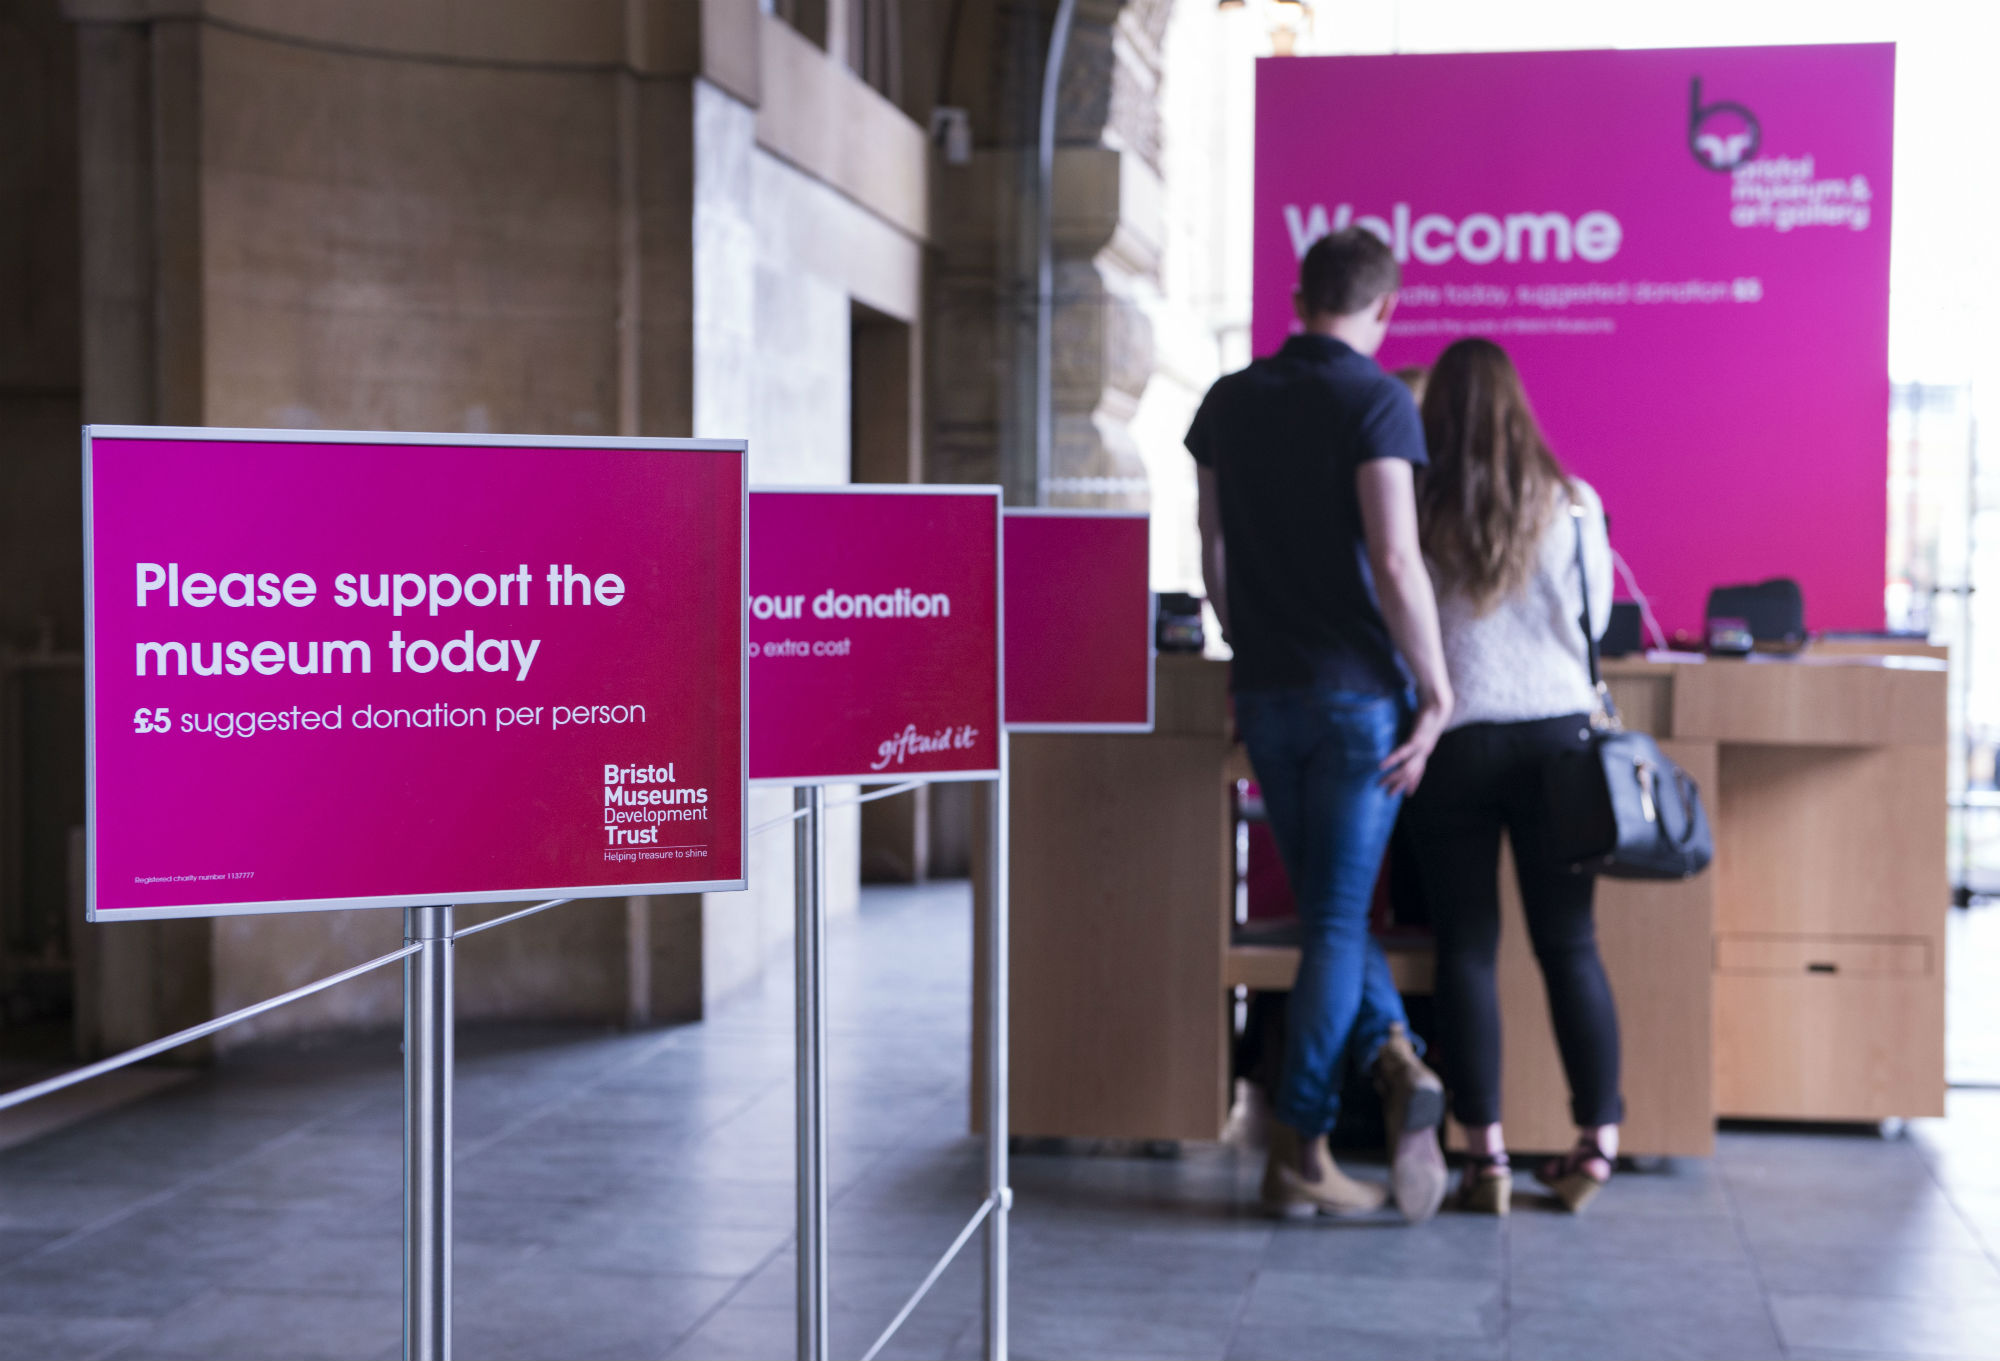
If you have been at Bristol Museum & Art Gallery within the last week, you might have noticed that our street-level entrance lobby is now a much more welcoming place for our visitors.
Staff at a new Welcome Desk now greet everyone as they enter the museum. Visitors are asked if they’ve been to the museum before, if they’ve come for a general look around or for an exhibition, talk or particular gallery or artefact.
Welcome Desk staff state that there’s no general admission fee and that donations are welcome, adding any highlights or their own personal favourites from what’s on display.
The visitor map has been improved to more graphically show the layout of the museum and share some of the highlights in the galleries. Finally, visitors are asked if they would like to make a donation today to Bristol Museums Development Trust (the independent registered charity that raises funds for Bristol Museums and Archives).
To explain why we are asking for donations, the editorial on the reverse of the visitor map explains that behind the scenes curators, conservators, documentation professionals and a host of other specialist staff are working to care for the collections, create new displays and encourage people of all ages and interests to discover more.
Illustrated examples of how the £5 suggested donation could help are also provided in the visitor map, for example to conserve an artefact, examine minerals more closely, or conserve a painting. The visitor map also outlines Bristol Museums’ sources of funds: this is approximately 40% from Bristol City Council, 30% from Arts Council England, and the remaining 30% coming from our shops, cafes, event hires, Friends groups, and fundraising from a variety of sources including visitors.
It is anticipated the new Welcome Desk will give passers-by more of an idea of what happens inside this Edwardian building, resulting in more people crossing the threshold. It should also significantly increase the donation per head (currently 7p per head at Bristol Museum & Art Gallery), thus bringing in much needed funds that will enable us to do more with our collections and thus improve the visitor experience.
The Welcome Desk is being trialled for four months, until the end of October. If you have any comments about the Welcome Desk project, please contact Valerie Harland at valerie.harland@bristol.gov.uk
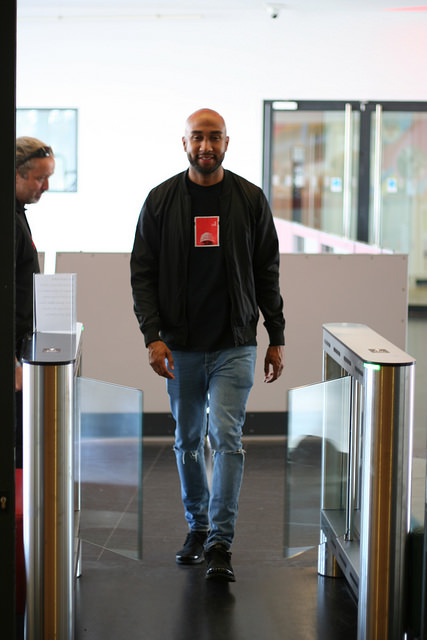
Image of Jake Mensah walking successfully through the barrier
This week we installed an entry gate system to our exhibition gallery at M Shed just in time for the opening of Children’s TV. Our “exhibition” gallery is located on the top floor, far away from the ground floor reception and not naturally easy to stumble across for the average wandering visitor. The project scope was to reduce the overall cost of an exhibition to the service and encourage as many visitors as possible to purchase tickets in advance. We’ll then test the success of the project against three of our key performance indicators – customer satisfaction, cost per transaction, and digital take-up.
Against each KPI we aim to:
Customer satisfaction – We don’t want people to experience a notable difference between our old approach of buying from a member of staff at the entrance and them buying online/kiosk and then entering the exhibition via the gate. We expect teething issues around the “behaviour” of this new approach but not from the technology itself which should be robust. The outcome we need is for little to no complaints within the first two weeks or until we find solutions for the teething problems.
Reduce cost per transaction – a typical paid exhibition costs approximately £7,000 to staff the ticket station. By moving to a one off fee (plus annual service) we’ll save money within 12 months and then in year two this will return a large saving for this function.
Increase digital take-up – until now it wasn’t possible to buy exhibition tickets online or using your mobile device at the museum. This is a feature that the new system enables so we’ll spend the next 18 months actively encouraging the public to buy a ticket “digitally” as part of our move to being digital by default. An additional benefit of using our website to buy tickets is that hopefully a percentage of these visitors will discover other services and events we offer. I also do wonder if we need to get a self-service kiosk to reduce the impact on the reception.
Setting up the entry gates
The third party supplier obviously manufactured and installed the gates but there was still lots for our team to deal with. We needed input from a whole gang of people. Our operations duo worked on ensuring we had the correct physical location, power, security and fire systems integration. Via collective feedback our visitor assistants provided various customer journeys and likely pinch points. Our digital team then helped with the installation and software integration for buying tickets. Design and marketing then helped with messaging. Throughout I was charged with overseeing the project and site visits with the supplier.
The major components of the project are:
Physical barriers – two stainless steel coated gates with a bunch of sensors and glass doors
Software for the barrier
Web service to purchase tickets
Onsite EPOS to sell tickets and print which is currently located at main reception
Initial observations
I was onsite for the launch and saw the first 50 or so visitors use the entry gates. My initial observations were that the gates didn’t negatively slow or concern the visitor and having asked a number of them it wasn’t a big deal. However an obvious pinch-point is that the barcode scanner doesn’t always read the barcode, leaving the visitor struggling. My hunch at this point is that our paper tickets are too thin and bendy which means the barcode scanner fails to recognise the barcode. In the coming week we’ll need to investigate if it is the barcode or barcode scanner as the primary cause and find a fix.
When multiple visitors arrive at the barrier there can be some confusion about how “one at a time” actually works. I’m hopeful that clear messaging will iron this out.
A slight issue was that we couldn’t take online payments due to a gateway issue which we’ll have fixed Monday.
Overall I’m very happy with the introduction of the gates and once we deal with the aforementioned teething issues it should be on to the next location for these gates. This is one of those projects that can only really be tested once they go live with real visitors, and the team did a fantastic job!
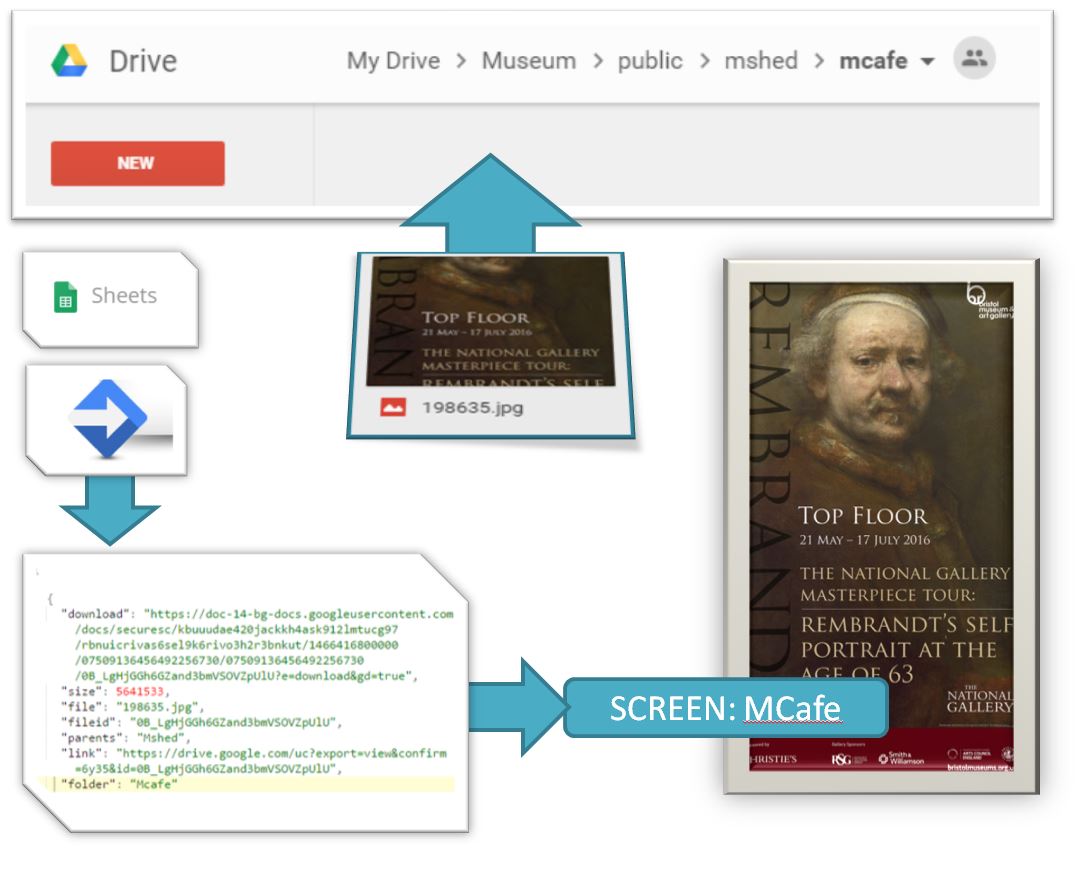
Having taken an agile development approach to our digital screen technology, it has been interesting as the various elements emerge based on our current needs. Lately there has been the need for quick ways to push posters and images to the screens for private events and one-off occasions.
Due to the complexity of the various modes, and the intricacies of events-based data and automatic scheduling it has been difficult incorporating these needs into the system. Our solution was to use Google Drive as a means to override the screens with temporary content. This means our staff can manage content for private events using tables and mobile devices, and watch the updates push through in real time.
The pathway of routes now looks like this
HOW?
There are two main elements to the override process – firstly, we are using BackboneJS as the application framework because this provides a routing structure that controls the various signage modes. We added a new route at the beginning of the process to check for content added to Google Drive – if there is no content the signs follow their normal modes of operation.
Google Drive Integration
Google provide a nice way to publish web services, hidden amongst the scripts editor inside Google sheets. We created a script that loops through a Drive directory and publishes a list of contents as JSON – you can see the result of that script here. By making the directory public, any images we load into the drive are picked up by the script. The screens then check the script for new content regularly. The good thing about this is that we can add content to specially named folders – if the folder names match either the venue or the specific machine name – all targeted screens will start showing that content.
It seems that this form of web hosting will be deprecated in Google Drive at the end of August 2016. But the links we are using to get the image might still work. If not we can find a workaround – possibly by listing urls to content hosted elsewhere in the Google sheet and looking that up.
The main benefits of this solution are being able to override the normal mode of operation using Google Drive on a mobile device. This even works with video – we added some more overrides so the poster mode doesn’t loop till the next slide until after the video has finished – video brings in several issues when considering timings for digital signage. One problem with hosting via Google Drive is that files over 25MB don’t work due to Google’s antivirus checking warning which prevents the files being released.
We’ll wait to see if this new functionality gets used – and if it is reliable after August 2016. In fact – this mode might be usable on its own to manage other screens around the various venues which until now were not up datable. If successful it will vastly reduce the need to run around with memory sticks before private events – and hopefully let us spend more time generating the wonderful content that the technology is designed to publish for our visitors.
You can download the latest release and try it for yourself here.
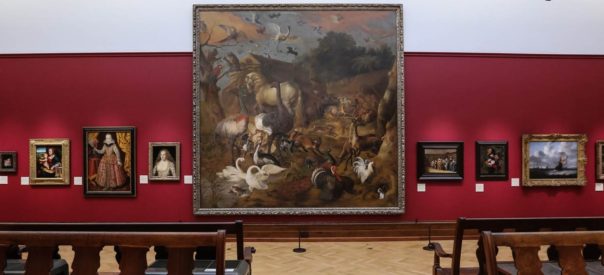
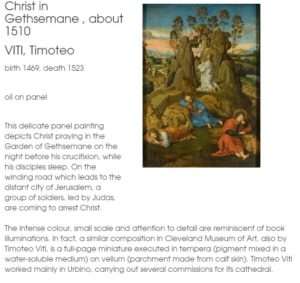
At Bristol Museums we use EMu to manage digital interpretation, and have several galleries with touchscreen kiosks displaying object narratives. We haven’t yet settled on a single technology, framework or data model as each new project gives us opportunities to test out new ideas, based on what our audiences want and on our previous learning. The refurbishment of our European Old Masters Gallery has given us the opportunity to extend the printed interpretation into digital.
(C) John Seaman, Bristol Culture
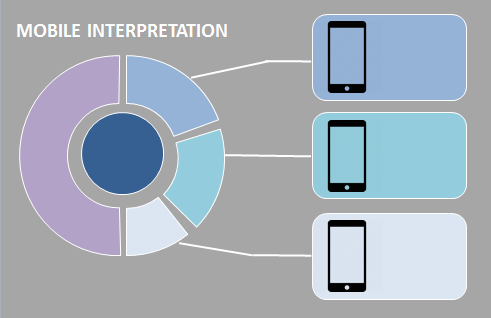
The classic look of the gallery means label space is kept to a minimum, and this had reduced the amount of printed interpretation available on the physical labels. Digital gives our curators the opportunity to expand on the depth of interpretation by writing more detailed descriptions of paintings. Our challenge was to come up with a solution that provided in-gallery mobile digital interpretation that was easy to access and fast to load, and that made sense in context.
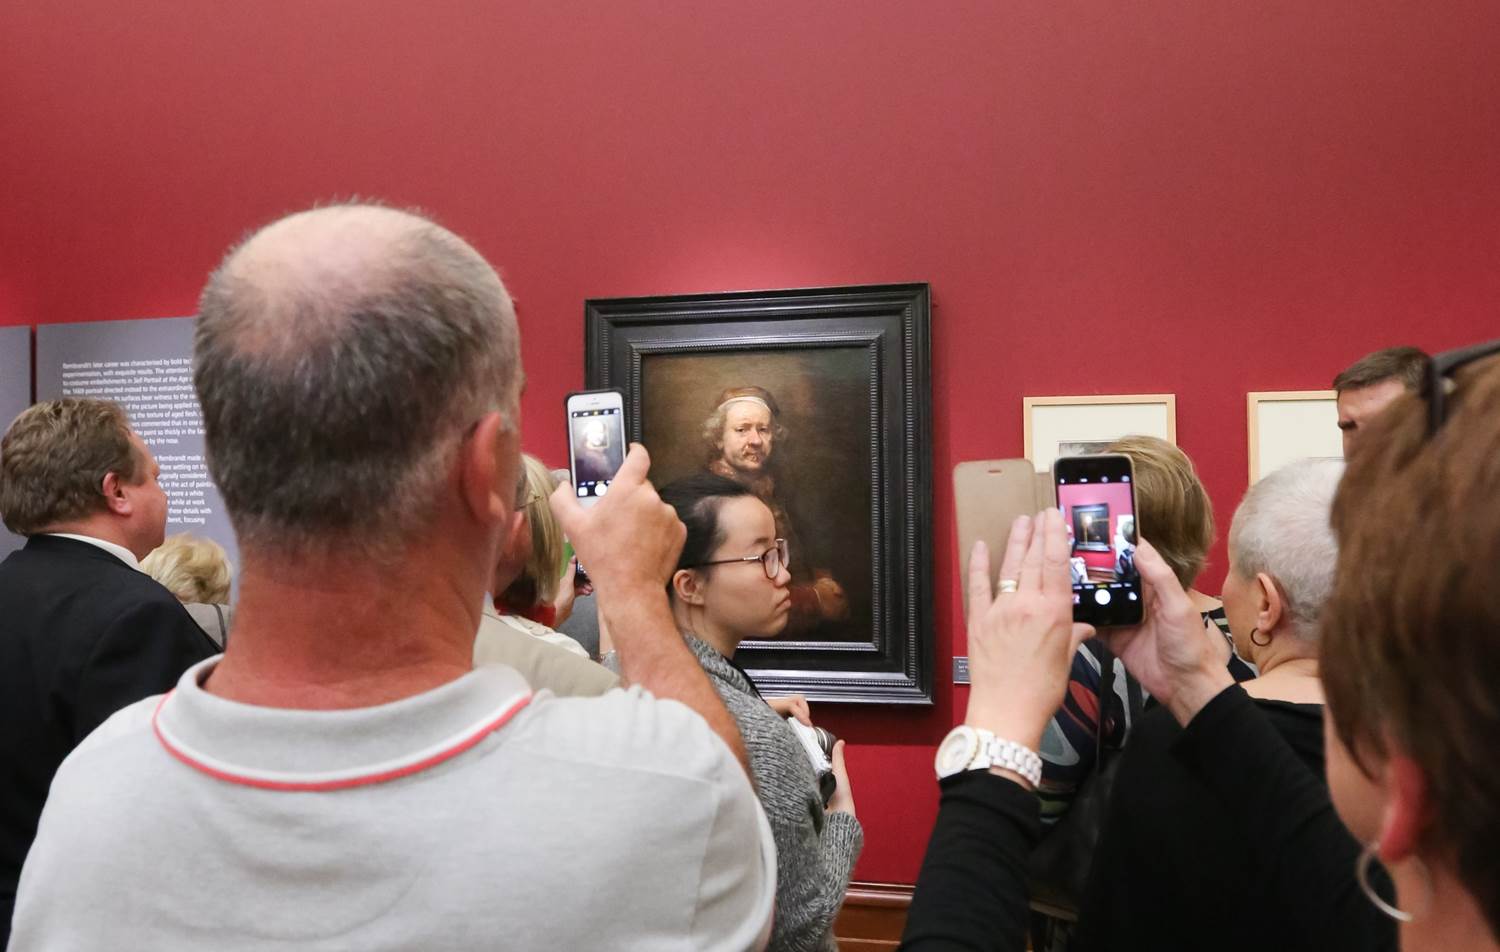
Taking a user-focused approach, we were keen to provide appropriate technology to the sorts of visitors to the gallery. Our audience research shows that mobile technology is a standard anong these visitors, as explained by Darren Roberts, our user researcher.
Our Audience segmentation shows that three of the Core Audience Segments for Rembrandt – City Sophisticates, Career Climbers, and Students – are all over 20% more likely than average visitors to use their mobile phone to access educational web content or apps. All three groups are also over 20% more likely than average to agree with the statement ‘I couldn’t live without the internet on my mobile’. These three segments account for over a third of the general audience for the museum.
Ranked in order of segments that are both most likely to have an interest in Antiques and Fine Art and use their mobile phone to access free educational content or apps:
Student Life
Lavish Lifestyles
City Sophisticates
Career Climbers
Executive Wealth
The top three are over 40% more likely than average visitors to engage in both these activities. All five are expected to be part of the core audience for the Rembrandt exhibition.
With this in mind, we set about analysing the printed labels – looking at where data could be brought in from our collections management system (EMu) automatically to minimise effort in writing content. As it turns out we already had most of this data (artist name, birth date, death date etc.) and so the main curatorial effort could be focused on text wiring for the labels, while we designed the template to bring the data together.
Thanks to some preliminary experiments, we already had a working framework to use – we are using AngularJS on the client side for rapid prototyping, templating, routing and deployment.
Our next challenge was to optimise performance and maximise up-time. Having been inspired by the linked open data movement, we opted for having the data sit in structured JSON files that could be reused multiple times by various apps without querying the database directly. This had the double effect of reliability and speed. We did a similar thing with multimedia, running a regular content refresh cycle and packing everything up for the app to use, with images saved at sizes for thumbnail and detail views.
The finished template was as follows – we opted for a minimalist design for east of reading, and with responsive elements the pages work across multiple devices.
The process of selecting source fields and mapping them to the template has inevitably thrown up areas where our database use could be improved, and where before we had data across many fields, now we have laid out better guidelines for object cataloguing that should ease this issue – for the app to work we needed set fields to extract information about the painting and artists.
We also had to deal with inconsistencies in terminology, for example the various ways dates could be written – on printed labels these variations are permitted, but we need to define the semantic patterns in order for this to work in digital. Now we have a workflow for improving the way we catalogue our objects as a result of this process.
Where some terms were abbreviated on the labels e.g “b” and”d” for birth and death – we expanded these on the digital labels as space was not an issue and we also felt this was easier for users to read and understand – digital allows us to implement some of our user focused principles without disrupting the printed gallery interpretation.
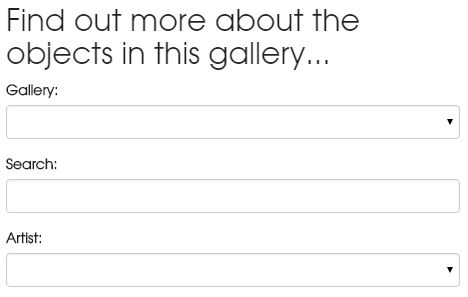
Through in-gallery user testing we found that whilst some features were obvious to us, visitors were not always getting to the bits we wanted them to see – we therefore added a call to action to make it clear what was available…
“Find out more about the objects in this gallery”
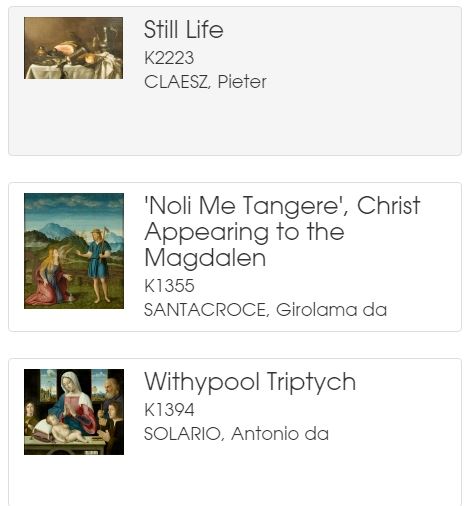
Something we are interested in finding out is how users navigate to their chosen painting. User stories and personas are one method we could use to get a better understanding of this. To facilitate various user journeys, we provide different routes to each digital label, either by searching by painting name, filtering on the artist’s name, or through browsing through the list view.
Technical details:
The routing mechanism of AngularJS gave us a simple way to navigate through from the list view to the record view by altering the # parameter as follows:
We also included some libraries for smooth page loading to improve the user experience. At this stage we don’t know whether the digital labels have a use outside the gallery, but in case the do we wanted the pictures to be zoomable, and there was a code library that allows this. N.B. this is not yet deep zoomable, but we are on the road to achieving that.
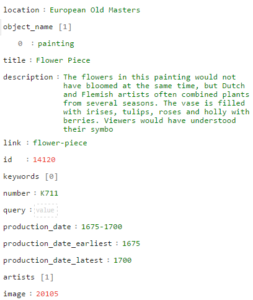
Data stuff
We want to be able to reuse our structured data on paintings and artists and their info and dates whenever new technology comes along, and so our data layer exists independently of the application, and it also sits outside our database on a publicly accessible endpoint. If you want to use any of it, in JSON form you can take a look here:
We store lists of objects in separate index.json files here:
museums.bristol.gov.uk/labels/data
And for details info about an object you can load up records by their id here:
museums.bristol.gov.uk/labels/id
Structures and paths may change as we develop the system so apologies if these are not accessible at any point. We change bits in order to improve issues with loading time and reliability, but we aim to resolve this to a standard approach to our data layer with time.
We are also figuring out what structure out object (json) records need to contain in order to maximise their use outside of our collection management system. Where dates and places exist in several source fields, we can prioritise these on export to choose which dates are most suitable, and similarly for places.
We construct a standard object schema in JSON as a result of a scheduled content refresh script which queries the IMu api, prioritises which fields to include the and saves as a JSON…
Next steps
We have implemented this in one gallery so far, and for one object type. We are now looking to roll this out to other galleries and look forward to similar challenges with different types of objects.
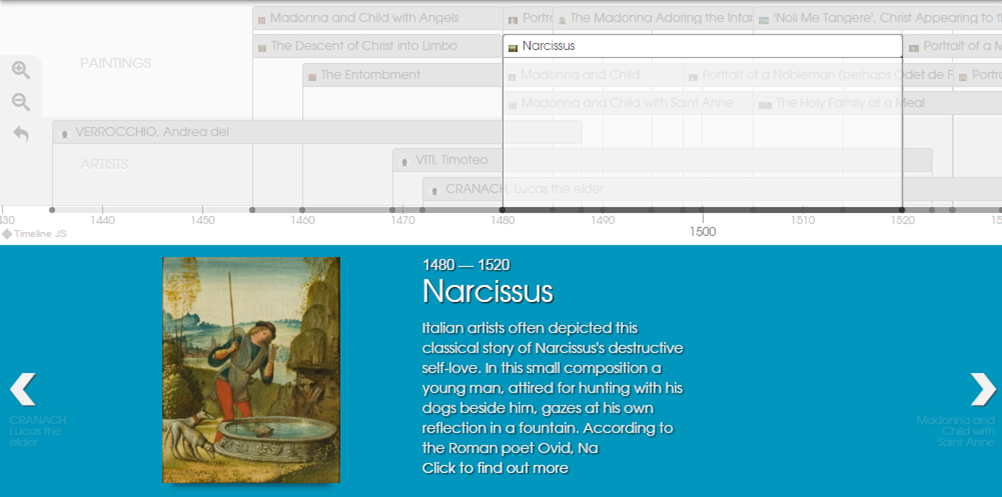
We are also extending the design of the prototype to bring in timelines and mapping functionality. These bring an interactive element to the experience and also provide new ways of visualising objects in time and space.
We included the TimelineJS3 library into our framework, and hooked it up to the same data powering the object labels. This provides a comparison of artists’ lives with each other, and with the paintings they produced.
We need to tweak the css a little, but out of the box it works well, thanks to the kind people at Knightlab.
The project has made us rethink some of our cataloging standards – we are aligning our internal data capture and export to be better equipped to make use of new web tools for public engagement.
We have decoupled the tasks of writing label text, and reusing object data and applying narrative metadata. We also have a process that would allow new layers of interpretation to be written and published to the same application architecture, and we can present a simplified data entry process to staff for this label writing process.
Although we haven’t solved the problem of how to improve uptake of the application in-gallery, we’ll be ready when someone does. If its ibeacons that do it – and we think it might be, we can direct users to a single object label using a unique url to our digital label.
For now though it is just a trusty old url to point people to the page where they then navigate further, but we’d love to remove this barrier at some point.
You can read lots about how the project came about by reading the various blog posts on here with the tag “hidden museum“.
The reason we haven’t made a big splash about the launch comes down to one word BATTERIES. As the app has taken so long to get into the app store we are yet to get the chance to run around the building and check all the battery levels of the ibeacons. Thus the app is available but living by its moniker and being hidden from general view for a few days. If you do get a chance to play the game please do let me know what you thought by leaving a comment, tweeting @bristolmuseum or email.
On to the next projects to ship, CRM and alpha visitor giving.
Thanks to all the good folks who made the project a reality on our team, aardman and The University of Bristol. Finally to The Digital R&D Fund for supporting us, challenging us and helping us make a little dent in the world.
The digital team at Bristol Culture face new challenges every day, and with diverse collections come a diverse range of problems when it comes to publishing online. One particularly taxing issue we encountered recently was how to represent and navigate through an archives collection appropriately on the web.
Here’s what Jayne Pucknell, an archivist at the Bristol Record Office, has to say:
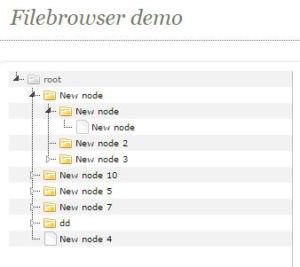
“To an archivist, individual items such as photographs are important but it is critical that we are able to see them within their context. When we catalogue a collection, we try to group records into series to reflect their provenance, and the original order in which they were created. These series or groups are displayed as a hierarchical ‘tree view’ which shows that arrangement.”
So far so good – we needed to display this tree-view online, and it just so happens there is a useful open source jquery plugin to help us achieve that, called jsTree.
The problem we found when we implemented this online, was that the tree view did not display the archive records in the correct order. The default sort was the order in which the records had been created, and although we were able to apply a sort to the records in our source database (EMu), we were unable to find a satisfactory sorting method that returned a numerical sort for the records based on their archival reference number. This is because the archival reference number is made up from a series of sub-numbers reflecting sub collections.
So this gave us a challenge to fix, and the opportunity to fix it was possible because of the EMu API and programming in between the source database and collections online. The trick was to write a php function that could reorder the archive tree before it was displayed.
Well, we did that and here’s a breakdown of what that function does:
The function takes 2 arguments – the archival number as a text string, and the level in the archive as an integer.
1.) split the reference number into an its subnumbers
2.) construct a new array from the subnumbers
3.) perform a special sort on the new array that takes into account each subnumber in turn
in theory that’s it – but looking at the code in hindsight there are a whole heap of complexities that would take longer to articulate here than just to past in the code, so lets make it open source and leave you to delve if you wish – here’s the code on Github
Another subtle complexity in this work is described further by Jayne:
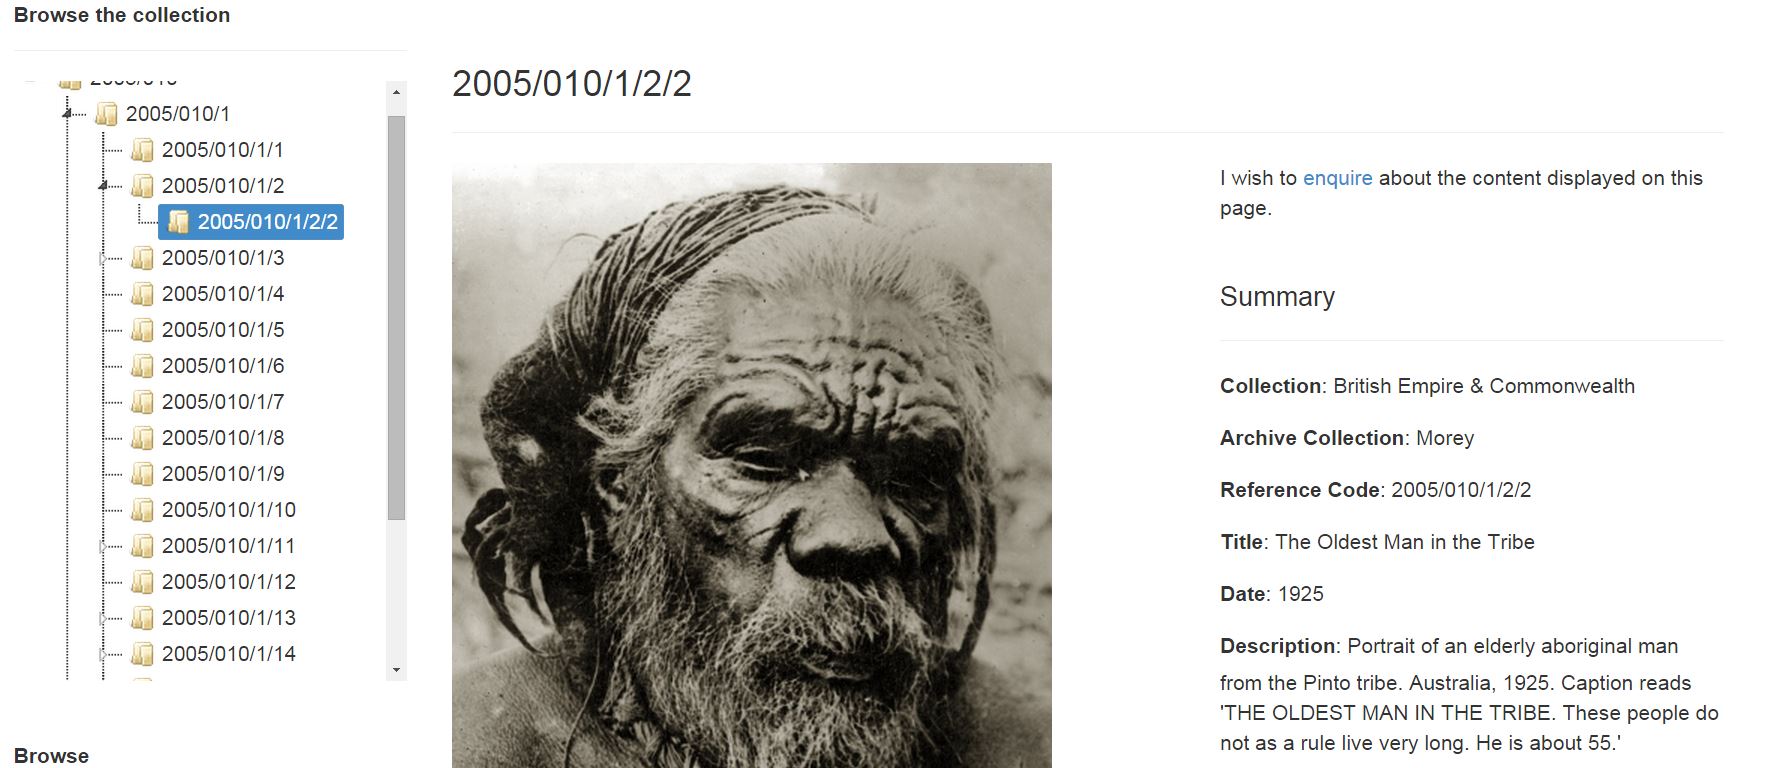
“You may search and find an individual photograph and its catalogue entry will explain the specific content of that image, but to understand its wider context it is helpful to be able to consider the collection as a whole. Or you may search and find one photograph of interest but then want to explore other items which came in with that photograph. By displaying the hierarchy, you are more easily able to navigate your way through the whole collection.”
Because of the way our collections online record pages are built – a record does not immediately contain links to all its parents or children. This is problematic when building the archives tree as ideally we wish each node to link to the parent or child depicted. We therefore needed a way to get the link for each related record whilst constructing the tree. Luckily we maintain the tree structure in EMu via the parent field.
The solution was to query the parent field and get the children of that parent, then loop through each child record and add a node to the tree. This process could be repeated up the parents until a record with no parents was reached and this would then become the root node. Because the html markup was the same for each node, this process could be written as a set of functions:
1.) has_parent: take a record number and perfom a search to see if it has a parent, if it does return the parent id.
2.) return_children: take a record number, search for its child records and return them as an array
2.) child_html: take an array of child records and construct the links for each in html
Taking advice from Jonathan Ainsworth from the University of Leeds Special Collections, who went through similar issues when building their online pages, we decided not to perform this recursively due to the chance of entering an infinite loop or incurring too much processing time. Instead I decided to call the functions for a set number of levels in the tree – this works as we did not expect more than seven levels. The thing to point out is that when you land on a particular record, the hierarchical level could be anything, but the programmed function to build the tree remains the same.
Here’s the result – using some css and the customisable features in jsTree we can indicate which is the selected record by highlighting. We also had to play around with the jsTree settings to enable the selected record to appear, by expanding each of its parent nodes in turn – to be honest it all got a bit loopy!
Hope this is of use to anyone going through similar issues – on the face of it the problem is a simple one, but as we are coming to learn in team digital – nothing is really ever just simple.
Hi, I’m Dhruv, and I’m a second year Computer Scientist at the University of Bristol. Along with 5 other team members, as part of our Software Product Engineering module, we are creating an interactive web-app for the Egypt Exhibition at the Bristol Museum.
The purpose of this web-app is to allow visitors to the museum to browse the exhibition whilst viewing more information about each of the exhibits on their phones, instead of the currently implemented kiosks. The following is a light technical overview of how it works.
The web-app is built on a full javascript stack involving Node.js and Express on the back-end and AngularJS on the front-end. Using frameworks based around the same language made it even easier for all members of our team to get involved with all parts of the application, as these skills easily transfer. Our system builds the website based on data exported from EMu, meaning that any updates to exhibit contents are easily displayed – be that tweaks to artefact data, or entire cabinet changes. We make this happen by designing templates for the specific types of page that exist, and use AngularJS to dynamically inject the appropriate content when the page is requested.
We decided to create a solution in this way as we felt it allowed a closer interaction with the content, along with dealing with the issue of multiple people using the kiosk at the same time. It also allows for user’s current accessibility settings (such as larger text for those with visual impairments) to be carried over.
The web-app is still in development, but some screenshots of the current implementation can be seen below.
We’ve been carrying out some user testing, and have had quite a bit of good feedback. Thanks to anyone who took the time to fill out our feedback forms!
Overall, the project has been thoroughly interesting, as it’s allowed me to expand my technical skills, but also through seeing bits of what makes Bristol Museum work smoothly.