Monthly Archives: April 2017

How to make two 120FT cranes talk to each other

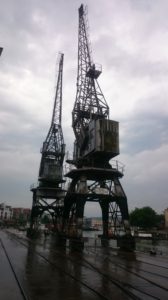
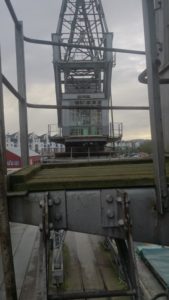
Here at M Shed Bristol, we have some great working exhibits from the bygone era of Bristol Harbour’s industrial past: steam engines, steam boats, steam cranes and more. But the most recognisable and iconic are the four great towering electric cranes standing over 120 feet above the old docks.

As the Industrial Museum was being transformed into the present day M Shed Museum two of the cranes would strike up conversations with each other, entertaining and informing passers-by of what they could look forward to seeing inside the new museum. However due to renovations and movement of the
cranes they fell silent again…

A few years later, due to popular demand I was tasked with bringing the cranes back to life!

To get these cranes talking was going to require rebuilding the whole audio and lighting system and recording new scripts. We were fortunate enough to have Alex Rankin, from our M Shed team, lend his penning abilities for the new scripts and Jacqui and Heather to voice the new crane characters.

To record the dialogu
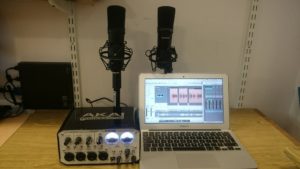
e, we arranged to meet in a nice quite corner of the L Shed store room. It’s a vast store, full of so many objects that there isn’t enough space to have them on permanent display. With both Jacqui and Heather sat at opposite ends of a table, I set up a pair of good quality condenser microphones. Each plugged into their own separate channel on my external sound card, an Akai EIE 4 channel usb sound card with great preamps and phantom powered for the mics. This in turn was hooked up to my MacBook and copy of Logic Pro. I recorded through each script a few times and was able to compile a seamless recording from the various takes. Once finished, I hard panned each channel left and right so that when each voice played back each would have its own speaker, left or right – crane 1 or crane 2.

To start building the new AV system, I searched around the vast L-Shed stores and work rooms to find what was left of the old system. I then decided what could be re used and what new equipment would be needed. I had been informed, by our volunteer team for the working exhibits, that everything had been removed from the cranes themselves; this meant starting from scratch.

The cranes themselves would need a loud speaker system for the voices and the crane cabs would need different coloured lights to flash in time with the talking as this helps to animate the cranes. That part was relatively easy. It meant scaling the cranes and bolting speakers to their underside and mounting lamps inside the cabs. I’ll be honest, I was helped by the Volunteer team and a huge mobile diesel powered cherry picker!


The hard part was how to feed the power and audio cables to the cranes. After some investigation it turned out that below the surface of the dockside was a network of underground pipes which lead to the base of each crane to feed their power. The great volunteer team once again worked miracles and fed over 600 combined meters of audio and lighting cables for me. This all led back to the clean room in their ground floor workshop. With all the cabling done I just needed to build a lighting control and audio playback system.


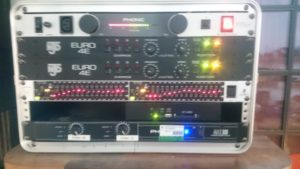
My design solution, using what kit I could find and a few new bits, was to use a solid state compact flash media player, graphic equaliser, audio mixing desk and power amplifier for the audio.  To have the light flash in time with the dialogue, I used a two light controller with a light to sound module, similar to what a DJ might use to have their disco lights flash to the music!

By having the audio go through the mixing desk, I was able to take an audio feed for each channel and direct them to lighting controllers. By recording the two voices in stereo, with each voice on its own left or right channel, it meant i only needed one media player and could easily control each channel on the sound desk. The graphic equaliser allowed me to tweak the speakers to acoustically fit their environment.

I looked at randomising the audio or having it triggered by people walking past, but with the amount of people who pass outside M Shed the cranes would be chatting away, non-stop all day! I decided to create a long audio file of about 3 hours with the different recorded scripts and random intervals of silence. These ranged from 5 minutes to 20 minutes, so it always comes as a surprise when they start talking to each other.

The results are really effective. It is always fun to see people being caught by surprise as the cranes light up and start a conversation and to see them stop and listen in on what they have to say.


How we did it: automating the retail order forms using Shopify.

*explicit content warning* this post makes reference to APIs.

THE PROBLEM:  Having set ourselves the challenge of improving the buying process  , our task in Team Digital was to figure out where we can do things more efficiently and smartly. Thanks to our implementation of Shopify, we have no shortage of data on sales to help with this, however the process of gathering the required information to place an order of more stock is time consuming – retail staff need to manually copy and paste machine-like product codes, look up supplier details and compile fresh order forms each time, all the while attention is taken away from what really matters, i.e. which products are currently selling, and which are not.

In a nutshell, the problem can be addressed by creating a specific view of our shop data – one that combines the cost of goods, with the inventory quantity (amount of stock left) in a way that factors in a specific period of time and which can be combined with supplier information so we know who to order each top selling product from, without having to look anything up. We were keen to get in to the world of Shopify development and thanks to the handy Shopify developer programme documentation & API help it was fairly painless to get a prototype up and running.

SETTING UP: We first had to understand the difference between public and private apps with Shopify.  A private app lets you hard code it to speak to a specific shop, whereas the public apps need to be able to authenticate on the fly to any shop. With this we felt a private app was the way to go, at least until we know it works!

Following this and armed with the various passwords and keys needed to programmatically interact with our store, the next step was to find a way to develop a query to give us the data we need, and then to automate the process  and present it in a meaningful way. By default Shopify provides its data as JSON, which is nice, if you are a computer.

TECHNICAL DETAILS: We set up a cron job on an AWS virtual machine running Node and MongoDB. Using the MEAN stack framework and some open source libraries to integrate with Google Sheets, and notably to handle asynchronous processes in a tidy way. If you’d like to explore the code – that’s all here. In addition to scheduled tasks we also built an AngularJS web client which allows staff to run reports manually and to change some settings.

Which translates as: In order to process the data automatically, we needed a database and computer setup that would allow us to talk to Shopify and Google Docs, and to run at a set time each day without human intervention.

The way that Shopify works means we couldn’t develop a single query to do the job in one go as you might in SQL (traditional database language). Also, there are limitations in how many times you can query the store. What emerged from our testing was a series of steps, and an algorithm which did multiple data extractions and recombination’s, which I’ll attempt to describe here. P.S. do shout if there is an easier way to do this ;).

STEP 1: Get a list of all products in the store. We’ll need these to know which supplier each product comes from, and the product types might help in further analysis.

STEP 2: Combine results of step one with the cost of goods. This information lives in a separate app and needs to be imported from a csv file. We’ll need this when we come to build our supplier order form.

STEP 3: Get a list of all orders within a certain period. This bit is the crucial factor in understanding what is currently selling. Whilst we do this, we’ll add in the data from the steps above so we can generate a table with all the information we need to make an order.

STEP 4: Count how many sales of each product type have taken place. This converts our list of individual transactions into a list of products with a count of sales. This uses the MongoDB aggregation pipeline and is what turns our raw data into something more meaningful. It looks a bit like this, (just so you know):

STEP 5: Add the data to a Google Sheet. What luck there is some open source code which we can use to hook our Shopify data up to Google. There are a few steps needed in order for the Google sheet to talk to our data – we basically have our server act as a Google user and share editing access with him, or her?. And while we are beginning to personify this system, we are calling it ‘Stockify’, the latest member of Team Digital, however Zak prefers the lofty moniker Dave.

The result is a table of top selling products in the last x number of days, with x being a variable we can control. The whole process takes quite a few minutes, especially if x >60, and this is due to limitations with each integration – you can only add a new line to a Google sheet once / second, and there are over 500 lines. The great thing about our app is that he/she doesn’t mind working at night or early in the morning, and on weekends or at other times when retail managers probably shouldn’t be looking at sales stats, but probably are. With Stockify/Dave scheduled for 7am each morning we know that when staff look at the data to do the ordering it will be an up to date assessment of the last 60 days’ worth of sales.

We now have the following columns in our Google Sheet, some have come directly from their corresponding Shopify table, whereas some have been calculated on the fly to give us a unique view of our data and on we can gain new insights from.

  • product_type: (from the product table)
  • variant_i:d (one product can have many variants)
  • price: (from the product table)
  • cost_of_goods: (imported from a csv)
  • order_cost: (cost_of_goods * amount sold)
  • sales_value: (price * amount sold)
  • name: (from the product table)
  • amount sold: (transaction table compared to product table / time)
  • inventory_quantity: (from the product table)
  • order_status: (if inventory_quantity < amount sold /time)
  • barcode: (from the product table)
  • sku: (from the product table)
  • vendor: (from the product table)
  • date_report_ru:n (so we know if the scheduled task failed)

TEST, ITERATE, REFINE:  For the first few iterations we failed it on some basic sense checking – not enough data was coming through. This turned out to be because we were running queries faster than the Shopify API would supply the data and transactions were missing. We fixed this with some loopy code, and now we are in the process of tweaking the period of time we wish to analyse – too short and we miss some important items, for example if a popular book hasn’t sold in the last x days, this might not be picked up in the sales report. Also – we need to factor in things like half term, Christmas and other festivals such as Chinese New Year, which Stockify/Dave can’t predict. Yet.

AUTOMATIC ORDER FORMS: To help staff compile the order form we used our latest Google-sheet-fu using  a combination of pick lists, named ranges and the query function to lookup all products tagged with a status of “Re-order”

A list of suppliers appears on the order form template:

and then this formula looks up the products for the chosen supplier and populates the order table:

“=QUERY(indirect(“last_60_days”&”!”&”11:685″),”select G where M='”&$B2&”‘ and J=’re-order'”)”

The trick is  for our app to check if the quantity sold in the last x days is less than the inventory quantity, in which case it goes on the order form.

NEXT STEPS: Oh we’re not done yet! with each step into automation we take, another possibility appears on the horizon…here’s some questions we’ll be asking our system in the coming weeks..

  • -How many products have not sold in the last x days?
  • -If the product type is books, can we order more if the inventory quantity goes below a certain threshold?
  • Even if a particular product has not sold in the last 60 days, can we flag this product type anyway so it gets added to our automatic order form?
  • While we are at it, do we need to look up supplier email addresses each time – cant we just have them appear by magic.

…furthermore we need to integrate this data with our CRM…..looks like we will be busy for a while longer.


Retail: Improving the buying process

Customers buy what they can pick from the shop floor or online catalogue. Not what is “on its way from a warehouse” or “gathering dust” on our stockroom shelf. Stock not available to the customer is therefore waste. A waste of committed money (cash flow concern which  immediately introduces risk) and a waste of space in our shop stockroom which in turns reduces overall shop floor space and slows staff looking for product.

Because “Buying” is the most critical of the four pillars of retail, it seems the sensible place to focus our attention on to gain further improvement. I’m going to challenge ourselves to use 2017-18 to maximise our buying by refining the workflow.    This will be a collaboration between me, retail, user research and our digital team.

At present we do our buying like any other retailer, we order by supplier when we feel or notice heavy product depletion. Furthermore at any one time we’re “holding” about 10% of our annual total stockholding in our stockroom and another 10% on the shop floor. If it is on the stockroom shelf it has zero chance of being sold.  In addition to having a costly quantity of product hanging around, the space used to hold our product could potentially be converted into public shop floor space. For example at Bristol Museum and Art Gallery there is a false wall which conceals our stockroom which is about 8m in length with a depth of 1.4m. If we’re about to improve how we buy, it is possible to push this wall back further and gain that space as public floor space that could be used for 2-4 nesting tables worth £10,000+. The challenge of course is that would reduce our total stockroom space by 2/3.

If we can nail our understanding of what to buy and when, this would unlock the potential to carry out operation “shrink the stockroom”. Order exactly what we need when we need it and not before.

The upsides would be:

  •  Move to a new process of ordering “just in time”
  • reduce stockroom size thus freeing up new floor space for customers worth £10,000+
  • reduce “out of stock” scenario by improving the buying process
  • order by need not assumption
  • reduce ordering time across the full year
  • reduce owning costly stock that may not sell which also takes up space
  • maximise available money set aside for buying products that sell
  • Reduce time lost by staff who have to hunt around a big stockroom
  • Heavily reduce human interaction which will reduce our cost per transaction and help us move to being digital by default
  • Allow retail manager to focus on other tasks