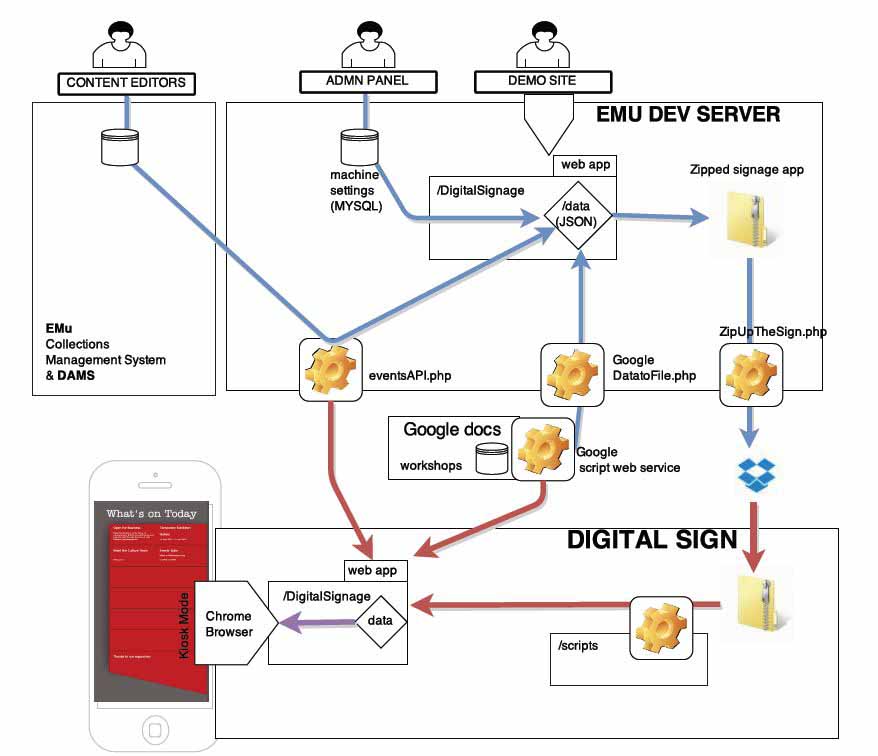
At this stage in the development of our digital signage, we have a working release of the software in the live environment, and we are focussing on training, improvements to the design and data structure for the next version. This post is about the nuts and bolts of how the client-side app works, while it is still fresh.

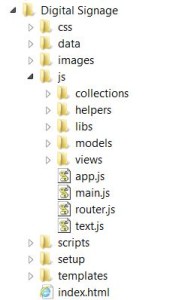
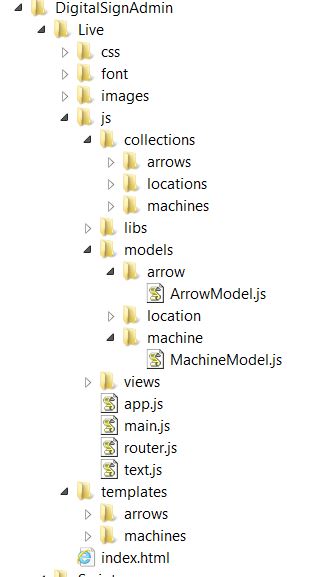
Firstly, it is a single page web application – loaded upon calling index.html from a web browser. Inside the index.html are just the basics you’d expect. The magic is all controlled via a master JavaScript file called require.js. This library is used to pull together all of the source code in the right order and makes sure files don’t get loaded twice etc. All of the content of the app is loaded and removed via a single content div in the body.
index.html
(... some bits removed...check the GitHub page for the whole lot)


<html>
  <head><title>BMGA Digital Signage</title>
     <link rel="stylesheet" href="css/styles.css">
     <script data-main="js/main" src="js/libs/require/require.js"/>
  </head>
  <body class="nocursor">
   <div id="mainContent" > </div></div>
  </body>
</html>
The first JavaScript to load up is main.JS. This simple file follows theRequireJS format, which is used to alias some of the code libraries which will get used the most such as JQuery.
//main.js

require.config({

 paths:{
     jquery:'libs/jquery/jquery-min',
     underscore:'libs/underscore/underscore-min',
     backbone:'libs/backbone/backbone-min',
     templates: '../templates'
 }
 })

require([

"app"], function(App) {
App.initialize();
});
Next up is main.js. This loads up the code libraries required to start the app, and brings in our first global function – used to close each ‘view’. For a single page app it is really important to destroy any lingering event handlers and other bits which can take up memory and cause the app to go a bit crazy – something that Backbone apps have difficulties with, and otherwise known as Zombie Views. Killing Zombies is important.
//main.js
define([
 'jquery',
 'underscore',
 'backbone',
 'router'

], function($, _, Backbone, Router){
var initialize = function(){


  Backbone.View.prototype.close = function () { //KILL ZOMBIE VIEWS!!!!
      this.undelegateEvents();
      this.$el.empty();
      this.unbind();
  };


   Router.initialize();
 };

 return {
     initialize: initialize
 };
});
It gets a bit more fun next as we call the backbone ‘router’ – and from now on I’ll only add snippets from the files, to see the lot head to GitHub. The router is what drives navigation through each of the modes that the screens can display. Each route takes its parameters from the url and so this means we can control the modes by appending the text ‘sponsors’, ‘posters’ or ‘events’ to the index.html in the browser.
In addition to the mode we can pass in parameters – which poster to display, which page of sponsors, which venue etc. This was a solution to the problem of how to remember which posters have not yet been shown. If you only wish the poster mode to last 40 seconds, but you’ve got lots of posters – you need to remember which posters come next in the sequence. Additionally as you loop through modes, you need to pass along each parameter until you are back on poster mode. This is why every route has all the parameters for venue and poster.
This slightly convoluted situation has arisen as we are using a page refresh to flip between modes and so without relying on local storage our variables are only around as long as the page lasts
//router.js

 var AppRouter = Backbone.Router.extend({
 routes: {
 'sponsors(/venue:venue)(/stick:stick)(/logo:page)(/poster:page)(/machine:machine)': 'sponsors',
 'posters(/venue:venue)(/stick:stick)(/logo:page)(/poster:page)(/machine:machine)': 'posters',
 'events(/venue:venue)(/stick:stick)(/logo:page)(/poster:page)(/machine:machine)(/date:all)':'events',

 }
 });
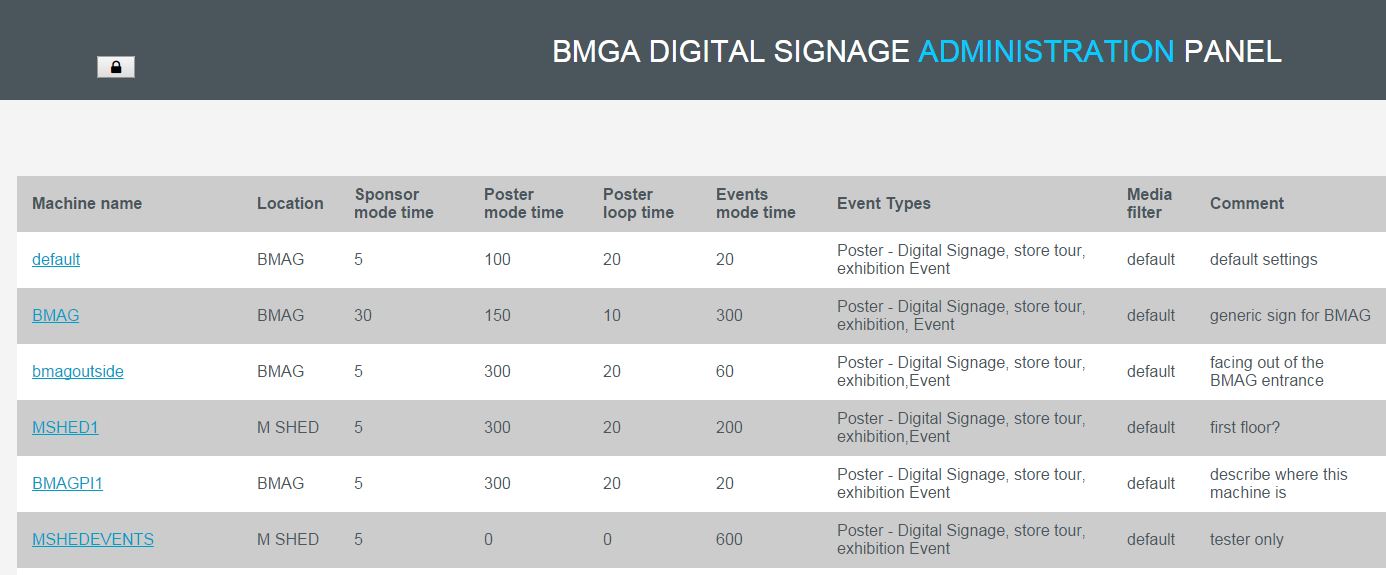
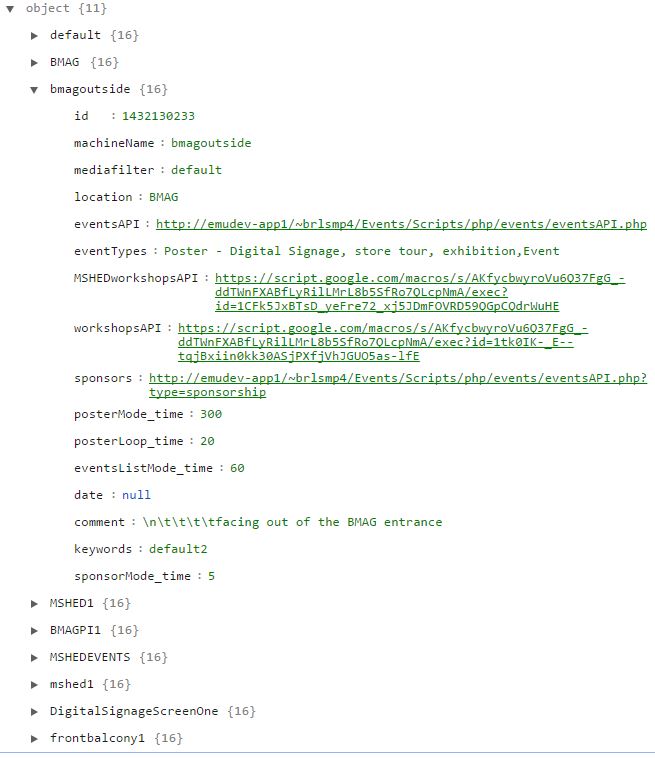
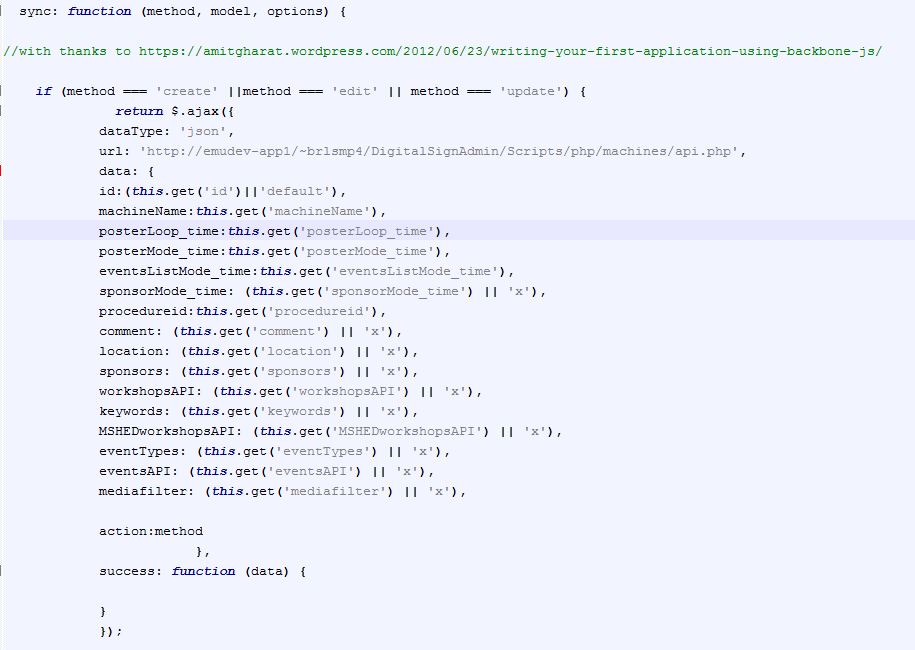
The code for a single route looks a bit like this and works as follows. We start off with an option to stick or move – this allows us to have a screen stay on a particular mode. Then we look at our settings.JSON file which contains the machine specific settings for all of the signs across each venue. The machine name is the only setting help locally on the system and this is used to let each machine find their node of settings (loop times, etc.).
...
 app_router.on('route:posters', function(venue,stick,logoOffset,posterOffset,machine){


 var stick = stick || "move"
 var logoOffset=logoOffset||0
 var posterOffset=posterOffset||0;

 machineName=machine||'default'
 Allsettings=(JSON.parse(Settings))
 settings=Allsettings.machineName
 settings=('Allsettings',Allsettings[machineName])


 var venue = settings.location;

 if(Globals.curentView){
 Globals.curentView.close()
 }

 var venue = venue || "ALL"
 self.venue=venue

 var posterView = new PosterView({venue:self.venue,stick: stick,logoOffset:logoOffset,posterOffset:posterOffset,machine:machine,settings:settings,type: settings.eventTypes});

 posterView.addPostersFromLocaLFile();
 Globals.curentView=posterView


 }),
....
With all settings loaded, and filtered by machine name and the mode specified – we are ready to load up the view. This contains all of the application logic for a particular mode, brings in the html templates for displaying the content, and performs the data fetches and other database functions needed to display current events/posters…more on that in a bit
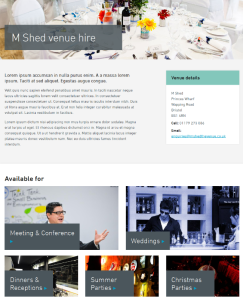
Amongst the code here are some functions used to check which orientation the image supplied is, and then cross reference that with the screen dimensions, and then check if that particular machine is ‘allowed’ to display mismatched content. Some are and some aren’t, it kinda depends. When we push a landscape poster to a portrait screen, we have lots of dead space. A4 looks OK on both but anything squished looks silly. So in the dead space we can display a strapline, which is nice, until there is only a tiny bit of dead space. Oh yep, there is some code to make the font smaller for a bit if there is just enough for a caption..etc. ….turns out poster mode wasn’t that easy after all!
//view.js

define([
 'jquery',
 'underscore',
 'backbone',
 'text!templates/posters/posterFullScreenTemplate_1080x1920.html',
 'text!templates/posters/posterFullScreenTemplate_1920x1080.html',
 'collections/posters/PostersCollection',
 'helpers/Globals',
], function($, _, Backbone, posterFullScreenTemplate ,posterFullScreenTemplateLandscape,PostersCollection,Globals){

 var PosterView = Backbone.View.extend({

 el: $("#eventsList"),

  addPostersFromLocaLFile: function(){

 var self = this;
 self.PostersCollection = new PostersCollection({parse:true})
 self.PostersCollection.fetch({ success : function(data){
 self.PostersCollection.reset(data.models[0].get('posters'))
 self.PostersCollection=(self.PostersCollection.byEventType(self.settings.eventTypes));
 self.PostersCollection=(self.PostersCollection.venueFilter(self.venue));
 self.renderPosters(self.PostersCollection)

 $( document ).ready(function() {

 setInterval(function(){

 self.renderPosters(self.PostersCollection)
 if(self.stick=="move"){
 setTimeout(function() {
 self.goToNextView(self.posterOffset)
 }, settings.posterMode_time * 1000);
 }
 }, settings.posterLoop_time * 1000);
 })

 }, dataType: "json" });

 },

 renderPosters: function (response) {

 if( self.posterOffset>= response.models.length){self.posterOffset=0}

 var width = (response.models[self.posterOffset].get('width'))
 var height = (response.models[self.posterOffset].get('height'))
 LANDSCAPE=(parseInt(width)>=parseInt(height))
 ImageProportion = width/height

 if(LANDSCAPE==true){break;}
 self.posterOffset++
 }
 }

 if(self.orientationSpecific==2){

 //enforced orientation lock
 while(LANDSCAPE==false ){

 if( self.posterOffset>= response.models.length){self.posterOffset=0}

 var width = (response.models[self.posterOffset].get('width'))
 var height = (response.models[self.posterOffset].get('height'))
 LANDSCAPE=(parseInt(width)>=parseInt(height))
 if(LANDSCAPE==true){break;}
 self.posterOffset++
 }
 }

 ImageProportion = width/height
 if(ImageProportion<=0.7){miniFont='miniFont'}
 if(ImageProportion<=0.6){miniFont='microFont'}
 if(ImageProportion<=0.5){miniFont='hideFont'}
 if(ImageProportion>=1.4){miniFont='hideFont'}
 console.log('ImageProportion'+ImageProportion)
 self.$el.html(self.PostertemplateLandscape({poster: response.models[self.posterOffset],displayCaption:displayCaption,miniFont:miniFont},offset=self.posterOffset,TemplateVarialbes=Globals.Globals));


 ....


return PosterView;

});
Referenced by the view is the file which acts as a database would do, called the collection, and there is a collection for each data type. The poster collection looks like this, and its main function is to point at a data source, in this case a local file, and then to allow us to perform operations on that data. We want to be able to filter on venue, and also on event type -(each machine can be set to filter on different event types) and so below you see the functions which do this… and they cater for various misspellings of our venues just in case 🙂
//postercollection.js
define([
'underscore',
'backbone',
'models/poster/posterModel'
], function(_, Backbone, SponsorModel){
var PosterCollection = Backbone.Collection.extend({
sort_key: 'startTime', // default sort key
url : function() {
var EventsAPI = 'data/posters.JSON';
return EventsAPI
},
byEventType: function(typex) {
typex=typex.toUpperCase()
filteredx = this.filter(function(box) {
var venuetoTest = box.get("type")
if( box.get("type")){
venuetoTest = (box.get("type").toUpperCase())}
return typex.indexOf(venuetoTest) !== -1;
});
return new PosterCollection(filteredx);
},
venueFilter: function(venue) {
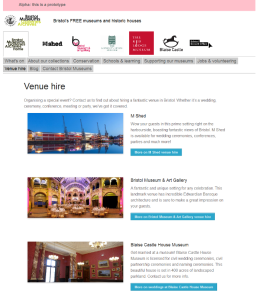
if(venue.toUpperCase()=="M SHED"){venue = "M SHED"}
if(venue.toUpperCase()=="BMAG"){venue = "BRISTOL MUSEUM AND ART GALLERY"}
if(venue.toUpperCase()=="MSHED"){venue = "M SHED"}
filteredx = this.filter(function(box) {
var venuetoTest = box.get("venue")
if( box.get("venue")){
venuetoTest = (box.get("venue").toUpperCase())}
return venuetoTest==venue ||box.get("venue")==null
});
return new PosterCollection(filteredx);
},
parse : function(data) {
return data
}
});
return PosterCollection;
});
Referenced by the collection is the model – this is where we define the data that each poster record will need. One thing to watch here is that the field names match exactly those in the data source. When backbone loads in data from a JSON file or API, it looks for these field names in the source data and loads up the records accordingly (models in backbone speak) . So once the source data is read, we populate our poster collection with models, each model contains the data for a single poster etc.
//postermodel.js


 define([
 'underscore',
 'backbone'
], function(_, Backbone) {

 PosterModel = Backbone.Model.extend({

 defaults: {

 category: 'exhibition',
 irn: '123456' ,
 startDate: '01/01/2015' ,
 endDate: '01/01/2015' ,
 venue: 'MSHED' ,
 caption: 'caption' ,
 strapline: 'strapline' ,
 copyright: '© Bristol Museums Galleries and Archives'


 },
 initialize: function(){
 //alert("Welcome to this world");
 },
 adopt: function( newChildsName ){
 // this.set({ child: newChildsName });
 }
 })

 return PosterModel;

});
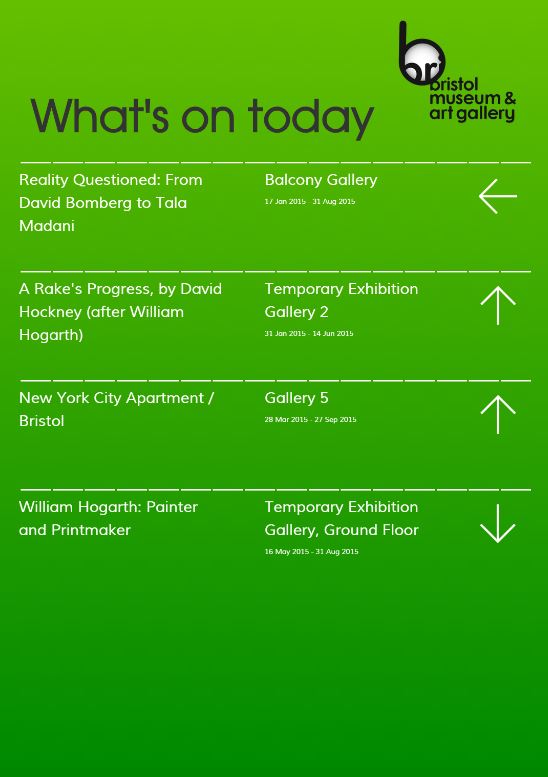
With the collection loaded with data, and all the necessary venue and event filters applied, it is time to present the content – this is where the templates come in. A template is an html file, with a difference. The poster template contains the markup and styling needed to fill the screen, and uses the underscore library to insert and images into the design.
/*posterFullScreenTemplate_1080x1920.html */

<style>

body{
    background-color:black;
    color: #BDBDBD;
}

#caption{
    position: relative;
    margin-top: 40px;
    width:100%;
   z-index:1;
  /*padding-left: 20px;*/
}

.captionText{
    font-weight: bold;
    font-size: 51.5px;
    line-height: 65px;
}

.miniFont{
   font-size:35 !important;
   line-height:1 !important;
}

...

</style>


<div id="sponsorCylcer">
 <%
 var imageError= TemplateVarialbes.ImageRedirectURL+ poster.get('irn') + TemplateVarialbes.ImageSizePrefix
 var imageError= TemplateVarialbes.ImageRedirectURL+poster.get('irn') + TemplateVarialbes.ImageSizePrefix
 %>
 <div id="poster_1" class="">
 <img onError="this.onerror=null;this.src='<% print(imageError) %>';" src="images/<%= poster.get('irn') %>.jpg" />
 <div id="imageCaption"> <%= poster.get('caption') %><br> <%= poster.get('copyright') %></div>
 </div>


 <% if (poster.get('type').indexOf("poster") !== -1 && displayCaption==true){ %>
 <div id="datesAndInfo">
 <h1>from <%= poster.get('startDate') %> till <%= poster.get('endDate') %></h1>
 </div>

 <%} else{
 if ( displayCaption==true){

 %>
 <div id="caption">
 <div class="captionText <% if( miniFont!=false){print(miniFont)} %>" > <%= poster.get('strapline').replace(/(?:\r\n|\r|\n)/g, '<br />') %> </div>
 <%} } %>
 </div>
</div>>


 <% if (poster.get('type').indexOf("poster") !== -1 && displayCaption==true){ %>
<div id="datesAndInfo">
<h1>from <%= poster.get('startDate') %> till <%= poster.get('endDate') %></h1>
</div>

<%} else{
if ( displayCaption==true){

%>
<div id="caption">
<div class="captionText <% if( miniFont!=false){print(miniFont)} %>" > <%= poster.get('strapline').replace(/(?:\r\n|\r|\n)/g, '<br />') %> </div>
<%} } %>
Once the template is loaded, the poster displays, and that’s pretty much job done for that particular mode, except that we want posters to be displayed on a loop, and so the view reloads the template every x seconds depending on what has been set for that machine using the digital signage administration panel. A master timer controls how long the poster loop has been running for and moves to the next mode after that time. Additionally a counter keeps a note of the number of posters displayed and passes that number across to the next mode so when poster mode comes back round, the next poster in the sequence is loaded.
Remarks
 Using the require backbone framework for the application has kept things tidy throughout the project and has meant that extending new modes and adding database fields is as hassle free as possible. It is easy to navigate to the exact file to make the changes – which is pretty important once the app gets beyond a certain size. Another good thing is that bugs in one mode don’t break the app, and if there is no content for a mode the app flips to the next without complaining – this is important in the live environment where there are no keyboards in easy reach to ‘OK’ any error messages.
Furthermore the app is robust – we have it running on Ubuntu, Windows 7 [in Chinese], and a Raspberry PI, and it hasn’t crashed so far. Actually if it does its job right, the application architecture won’t get noticed at all (which is why I am writing this blog) – and the content will shine through…. one reason I have avoided any scrolling text or animations so far – posters look great just as they are, filling the screen.
Now that our content editors are getting to grips with the system, we are starting to gather consensus about which modes should be prominent, in which places – after all if you have different modes, not every visitor will see the same content – so it there any point in different modes? Let the testing commence!
Acknowledgements
Thanks to Thomas Davis for the helpful info at backbonetutorials.com and Andrew Henderson for help Killing Zombies.

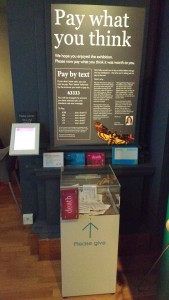
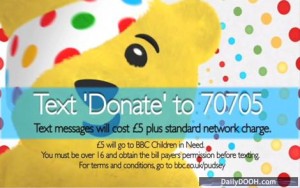 seen in things like charity appeals and car parks. Anyone who has used a text to pay system before will know that it is a very simple way of making a payment as it generally doesn’t require sign-up or registration. Instead, the user simply sends a text message containing a specific word to a specific number and a set amount of money is paid (I’ll explain in more detail below).
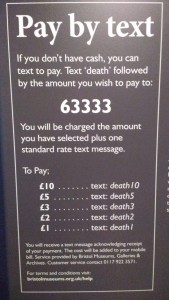
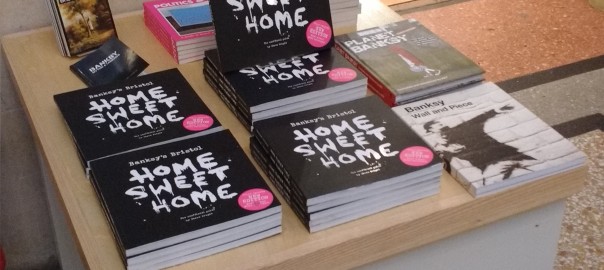
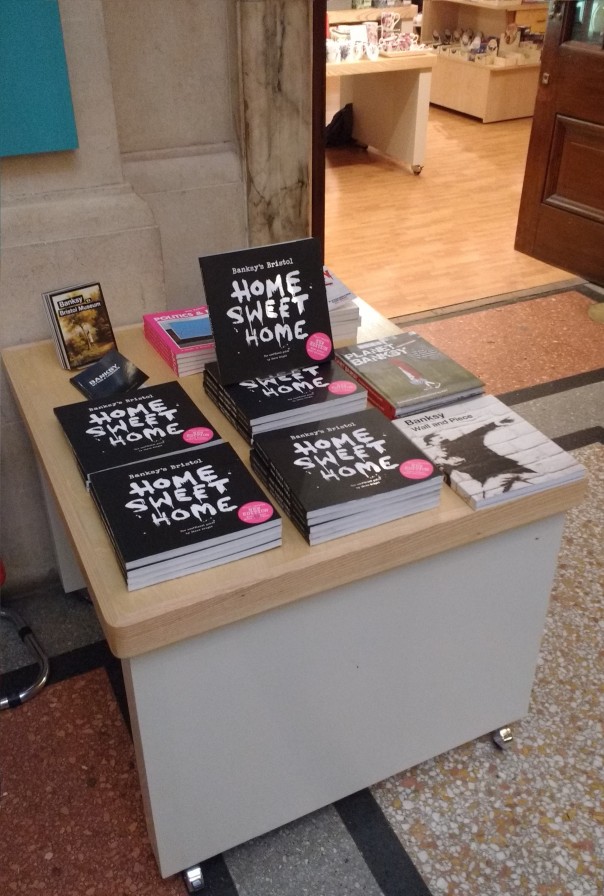
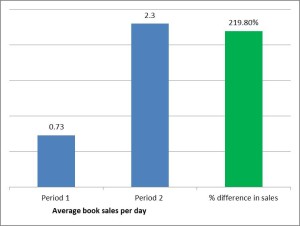 he period we have displayed the Banksy books on the shop-front table, there has been an increase in sales of 219.8%
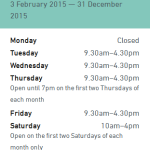 We also worked a bit on improving how our opening times are displayed. We added the option to add ‘notes’ to particular days, which is mainly for