This is an Interview with Tom Marshman about an alternative audio tour available at M Shed
Q: Can you describe the new resource you have created?
A: Working together with Rowan Evans (sound artist) we have created an alternative audio tour of the M-shed.
The tour connects up some of the stories I have collected for my performance work within the exhibition about Bristol, sharing stories I heard when interviewing older LGBT people in Bristol about the stories that lie at the roots of their LGBT identity.
The stories are funny and touching, and I’ve presented them very lyrically so the tour almost becomes a long poem that moves you around the first and ground floors of the M-shed.
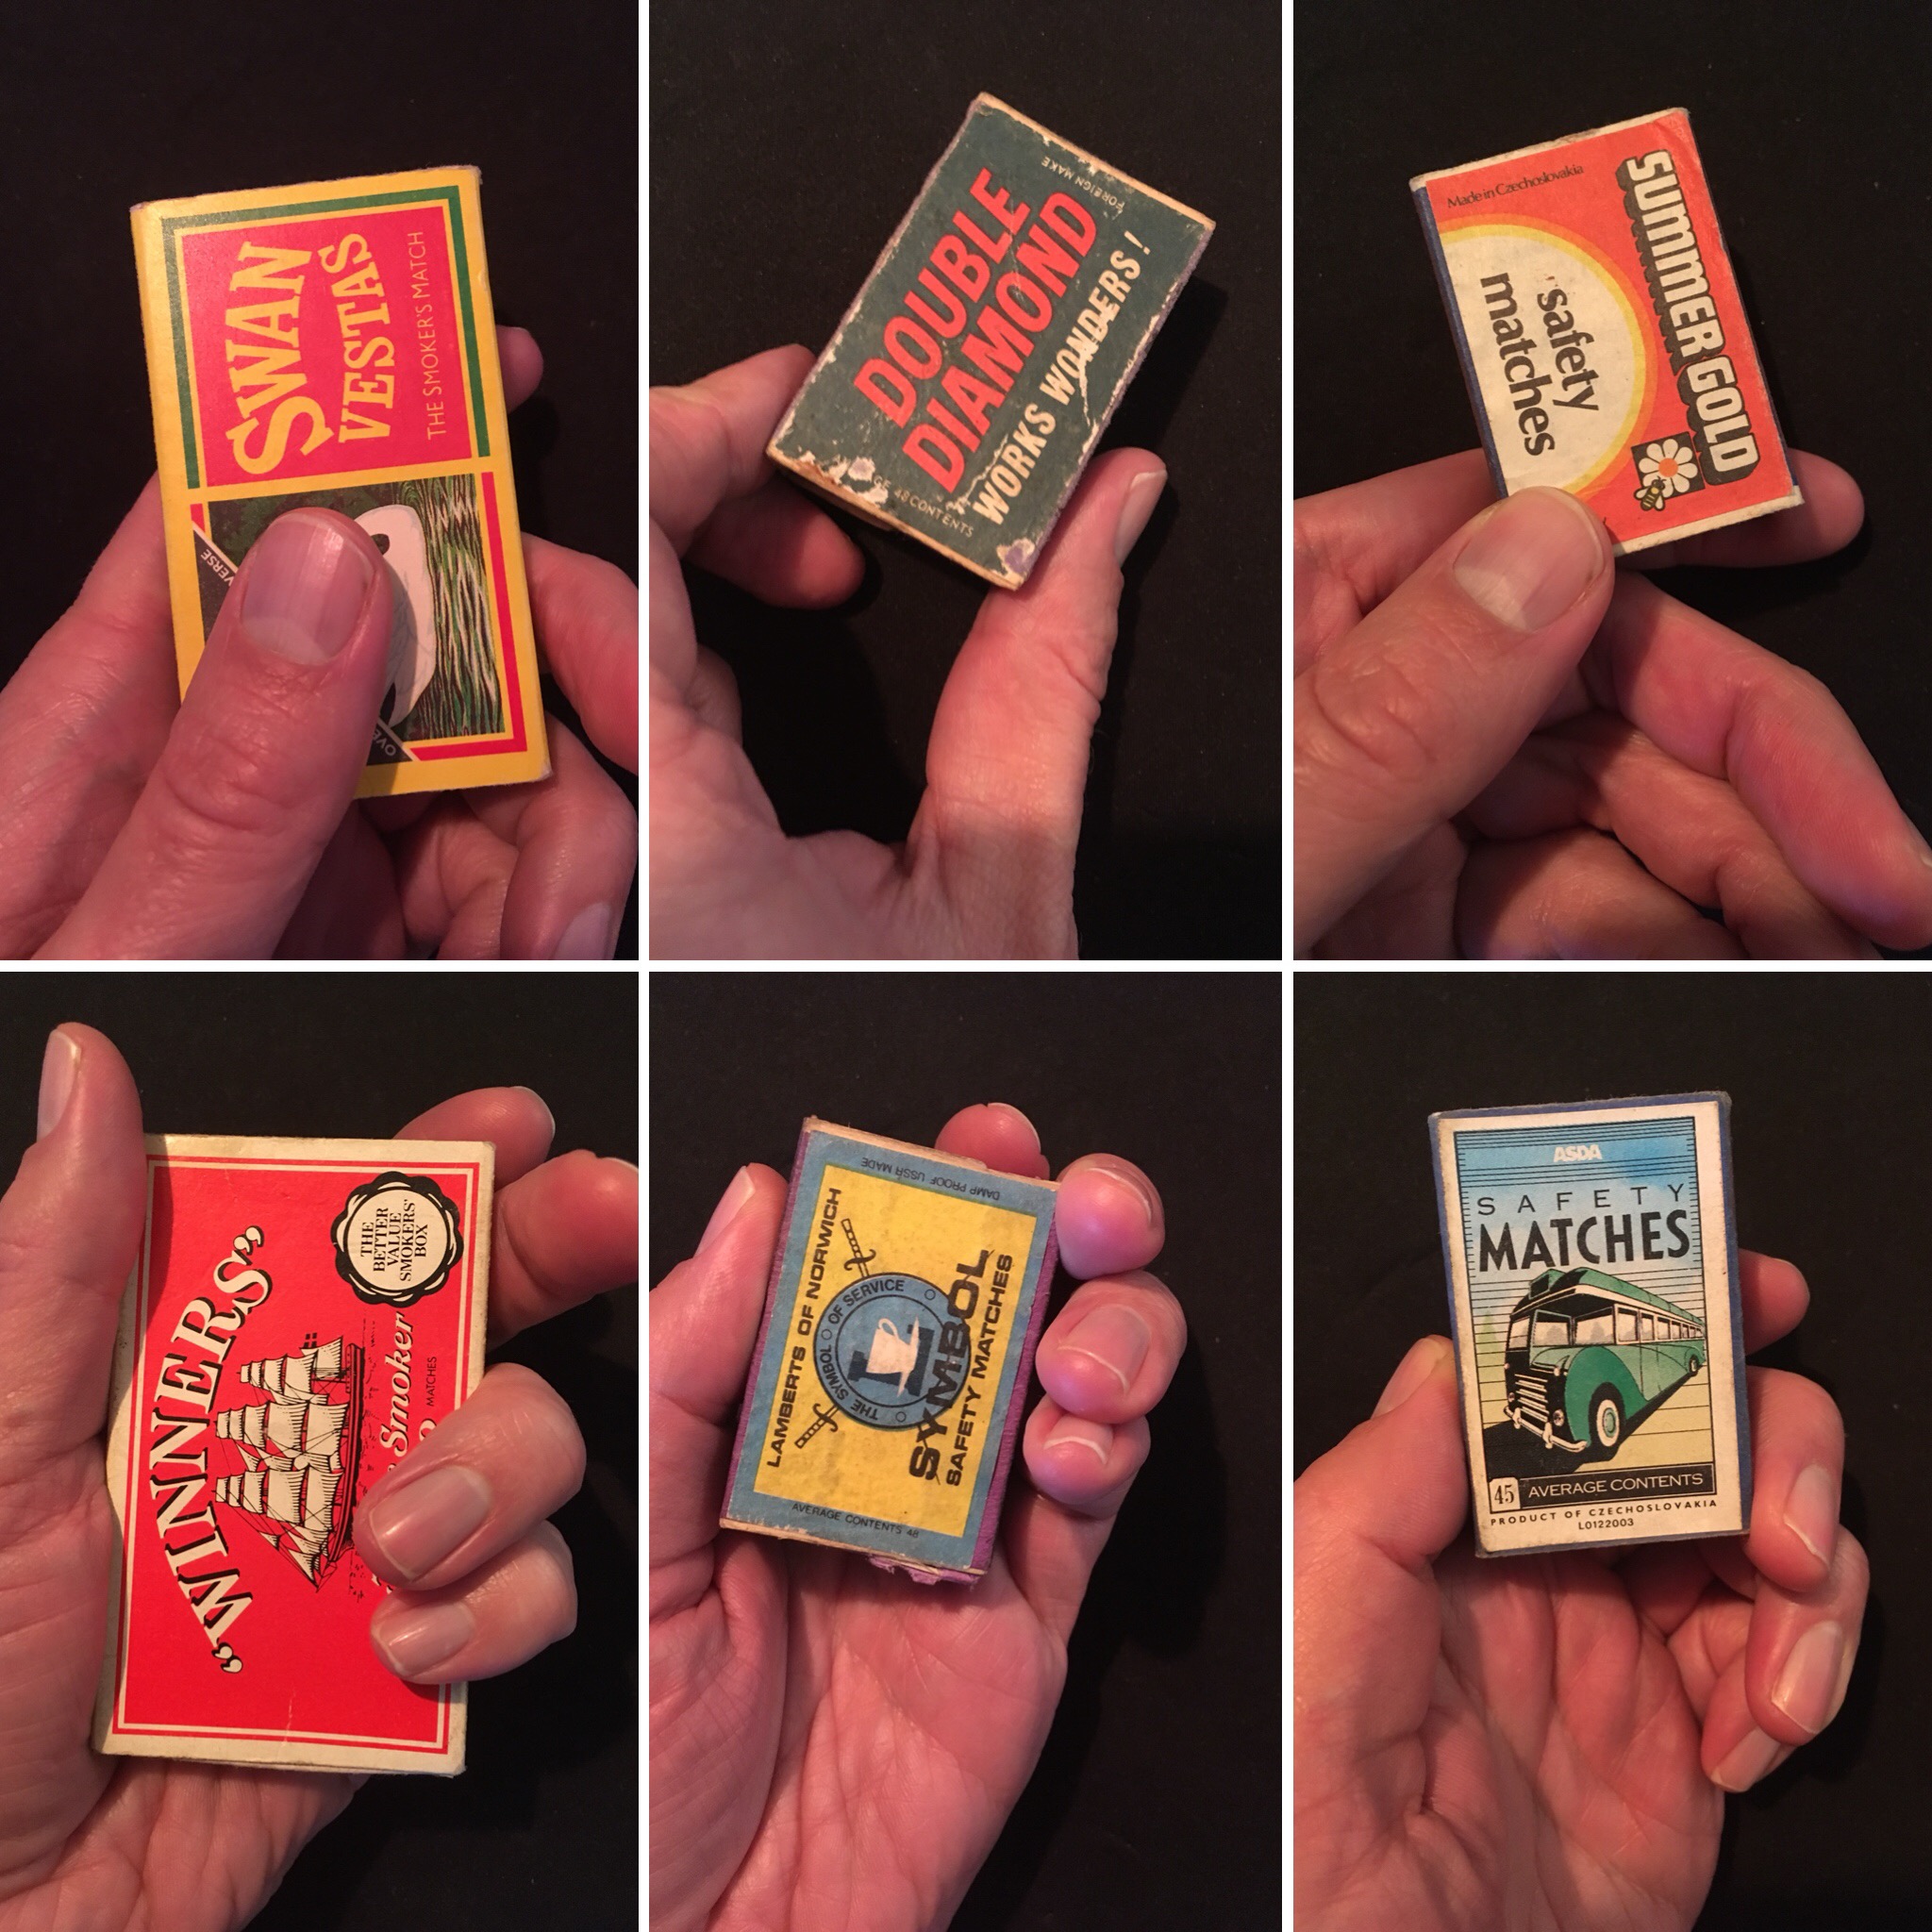
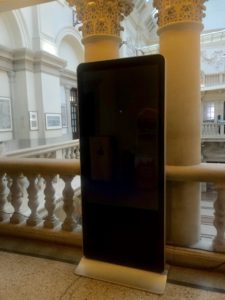
If you would like to do the tour the audio devices are kept behind the information desk on the ground floor, all you need to do is ask for one from a member of staff. The audio devices are encased in vintage matches, so you collect your headphones and match box and move around the space.
The piece was originally a live performance walk around the old city, around St Nicholas market so a lot of the stories are based there, most significantly the Radnor Hotel, which was a known gay venue from the 1930’s onwards.
Q: What is it about audio that made you decide to use this medium?
A: Each story is represented by the sound of a match striking; the stories burn brightly and quickly like a match, sharing a story before you move on to the next story. The idea for this came from one particular story where a man met his life partner by being asked for a light.
I really wanted people to feel like they were heading back in time with this work and that there was a retro vibe going on. I didn’t want them walking around the galleries with cutting edge technology I wanted something more tactile and evocative of stories people tell, this is why I chose the matchbox.
Q: How does your product differ from a usual museum audio guide?
A: In my work I am not so concerned with facts and figures, what I want to do is tell a good story and in particular the stories of older LGBT people which could soon be lost.
I think they add a new texture to the exhibits in the M Shed, bringing out the human stories within the objects and focusing on LGBT stories. LGBT stories are often whitewashed in museum versions of history, where we told the stories of the ‘powerful white upper class men’ instead. This work, I think, helps address this imbalance, and adds a new range of stories so that M Shed represents the diverse and exciting Bristol we live in.
These are stories I think everyone will enjoy hearing the stories, although some of the language is a bit racy so over 16’s only!
Q: Do you think the technology presents any barriers to access?
A: As an artist I’m based at the Pervasive Media Studio within Watershed Cinema where many artists and technologists are exploring ways to work with technology in new and exciting ways.
Amusingly, I am a technophobe, so for me to understand it, it has to be very simple. Because of this, what we have created is super easy to use, the only thing you have to do is turn it on, find the right volume, and follow the directions of where to move to within the audio tour. If people have smartphones they can also request a link or scan a QR code, to find the tour online. So technically they don’t need to have the matchbox, but I feel that spoils the fun slightly!
The important thing for me, when I am working with technology, is that it doesn’t get in the way of the stories and that the technology supports it, rather than presenting a barrier. And if anyone finds any teething problems, then I hope they’d mention it to the information desk so we can improve accessibility.
Q: How do you think the museum could learn from this project when developing their own audio resources?
A: The M-shed is not just about Bristol as a place, it’s also about the people of Bristol. And I love that it places importance on a wide-range of people too, not just people that are deemed to be ‘the great and the good’. I think our project reinforces that and tells us about a group of people whom you don’t often hear about.
I hope adding this will bring new LGBT audiences into museums to connect them to our history, as well as introducing non-LGBT museum-goers to it, all in an engaging and fun way.
As an artist I love working in museums because they are rich in stories, and I think it’s important to find new ways to share and celebrate within the museums.
Move Over Darling talks about people’s lives, deaths, loves, friendships and sex lives in a way that many museums don’t. The way our society treated LGBT people up until very recently has become a shocking and shameful secret history, and projects like this one can help museums tackle these difficult issues as well making sure the positive stories of LGBT people are not lost.
There’s a personable quality to the work I make too. All the people I tell my stories about on the audio tour I have met, I know them and we have exchanged our stories in face-to-face conversation. Though you don’t get to hear my stories on the tour, the human exchange during this research has indelibly influenced and shaped how I tell these stories. Sadly a big contributor to the content passed away last year, it is nice that his stories are present in the museum in this way.
Q: How can people access the content?
A: You can collect the matchboxes from the front desk at the M-shed anytime they are open, you can also find it online here and listen as you walk around the museums.
This is an ongoing part of the exhibition so hopefully my voice will be in the museum forever or at least until it doesn’t feel relevant anymore. Perhaps in a few years I will add more stories, we’ll see!
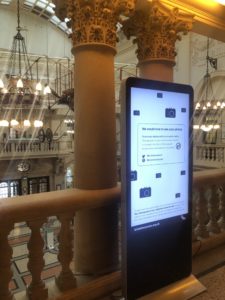
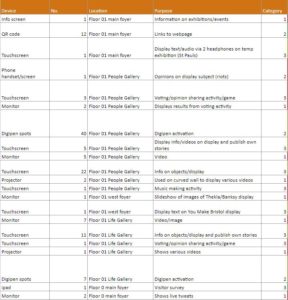 But what about all of the digital interpretation in our permanent galleries? Focusing on the two main museums mentioned above, we’ve got a wide range of interp such as info screens,
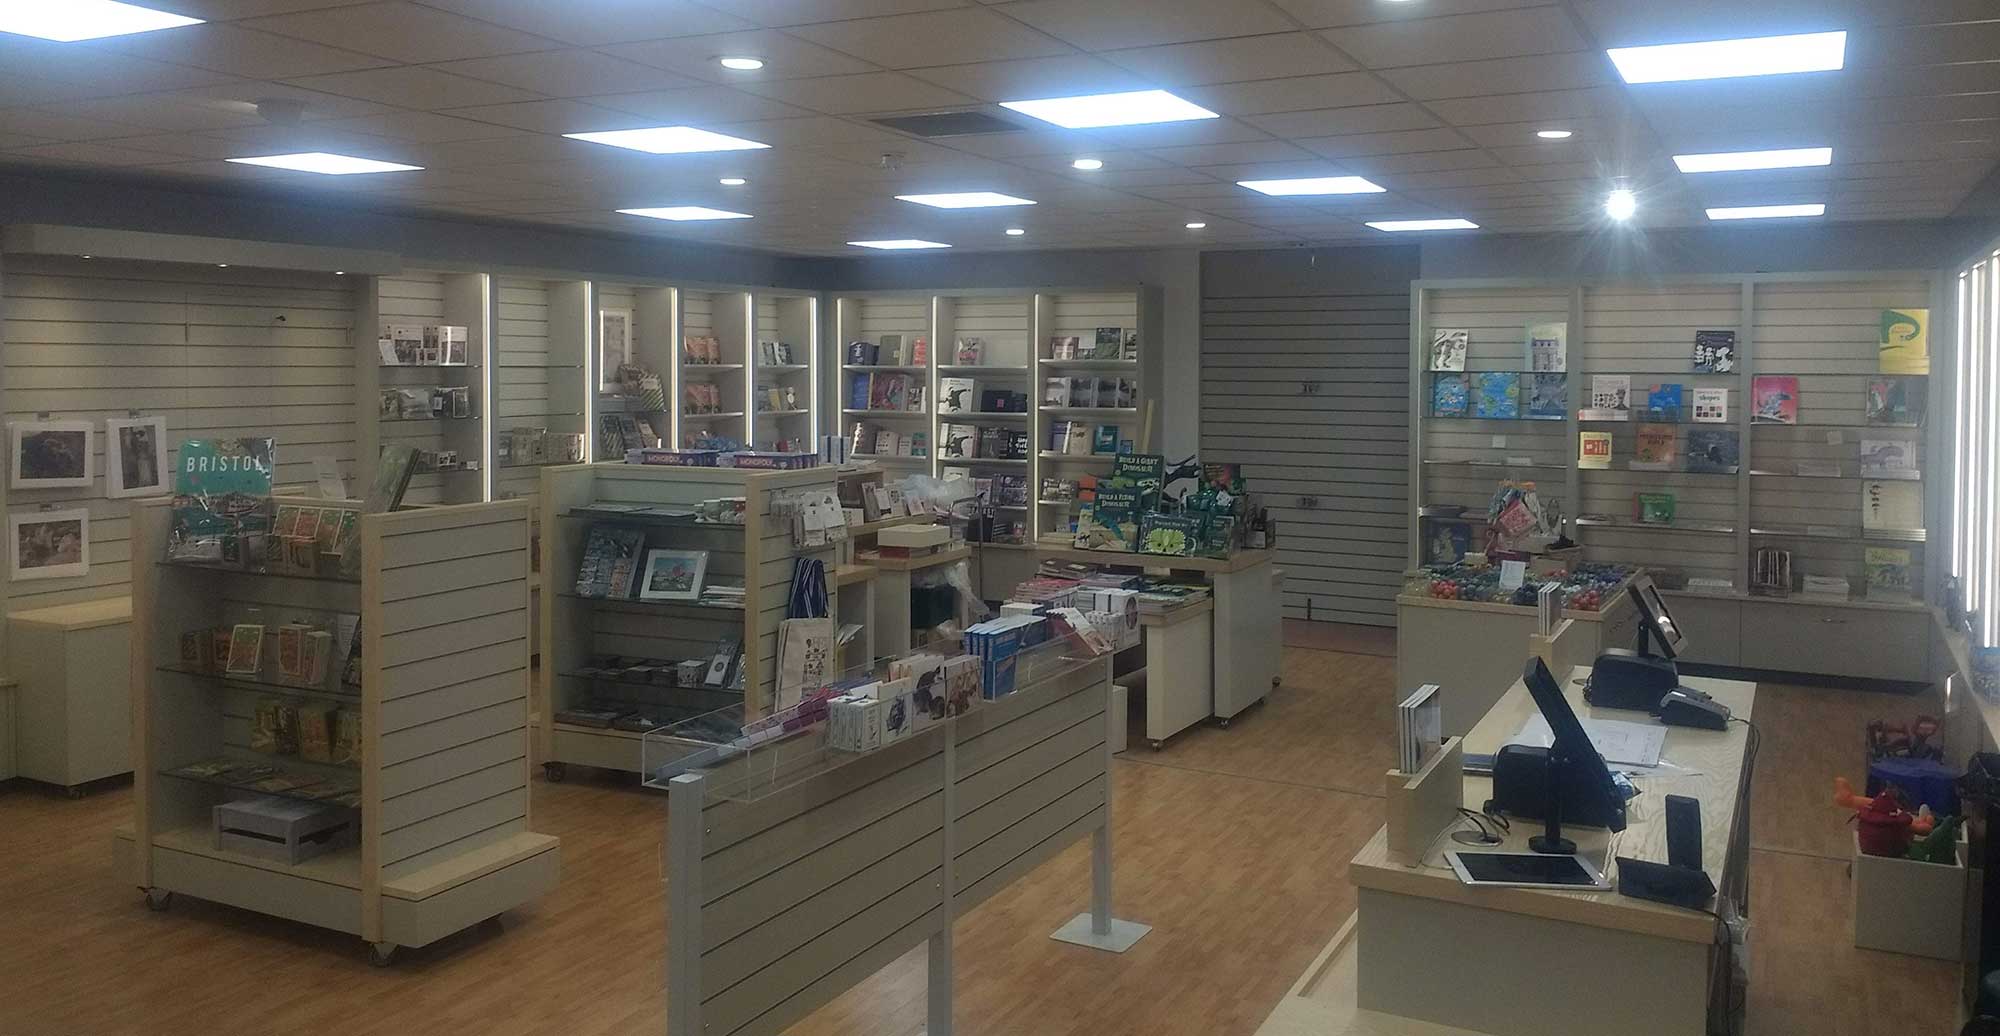
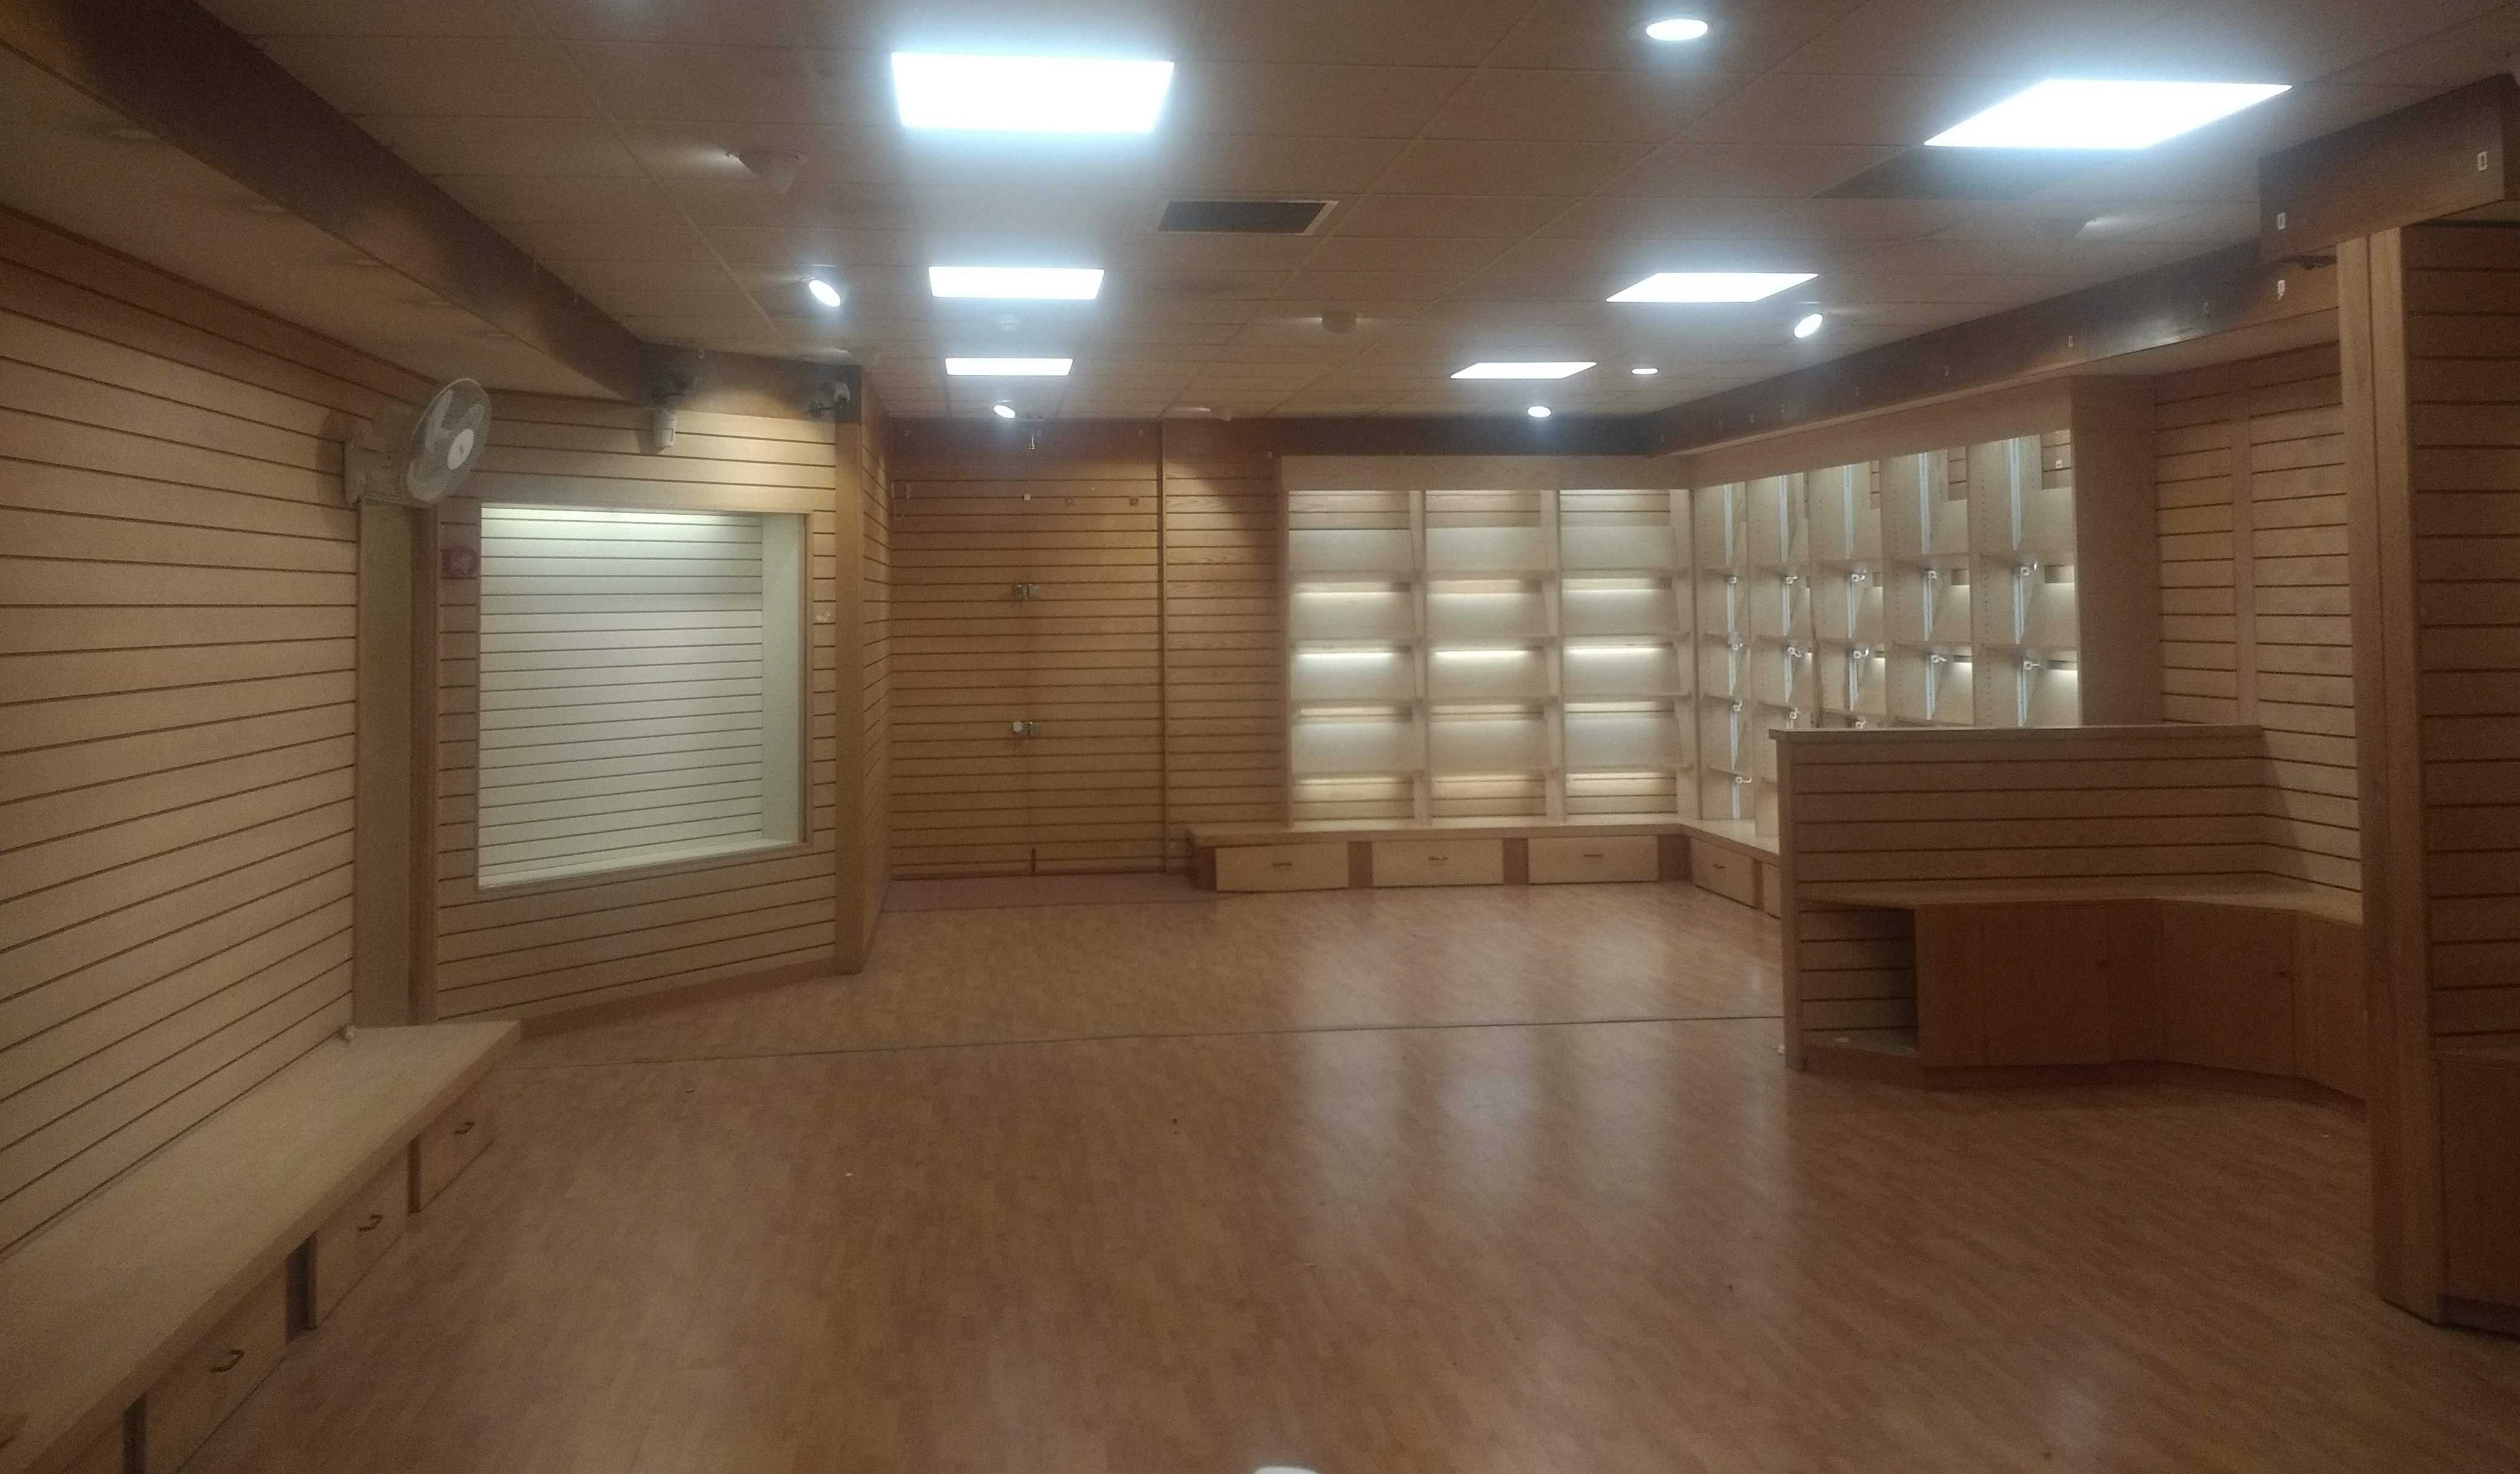 The shop just hours before the refit to rip out the stockroom, install new bays and maximise the space