My name is Steffan Le Prince, I am a Digital Assistant and am primarily based at M Shed, having started the role 2 months ago. My main focus is fixing the digital interactives in the museum, I also support colleagues with technical problems and help set up and roll out new digital tech and exhibitions here, lately I’ve been working on new digital signage using the Signagelive content management system.
Living in Bristol since 6 years of age, it’s spiritually where I’m from. I have a varied educational and previous work background, I studied Computer Games Technology at University and also completed a higher education course in Music Production. I have worked from a delivery driver, to a go kart centre marshal, to a mobile arcade games area provider for events to a remote technical support agent over the phone. This role allows me to draw from all these experiences (fixing the interactives can be surprisingly similar to fixing a game!).
I was thrown in at the deep end on my first day, when the WiFi in shop and box office of M Shed went down, helping to troubleshoot this half way through my induction conversation. This straight away was so interesting and hands on, quite a challenge for me and co-Digital Assistant Jack Evans at Bristol Museum and Art Gallery, where the same WiFi issue also happened at the same time.
I love working for Bristol Culture in the Digital Team, the role combines the troubleshooting aspect that I have enjoyed in previous work and I find it really rewarding fixing technical issues and being part of the team at a local museum, M-Shed is a good fit for me as Bristol life, music, people, places and street art have all have a big impact on my life.
My name is Jack Evans and I’m one of the new Digital Assistants at Bristol Culture. I am currently based at Bristol Museum & Art Gallery and I help the Museum by maintaining the technology we have in the galleries.
I am from Dursley, Gloucestershire and have lived in the South West for most of my life. After secondary school, I stayed on to do A-Levels in Computing, ICT, and Art and then went on to do a Foundation Diploma in Art and Design at SGS College. After which I went to University and as of this Summer I finished my degree in Fine Art at Falmouth University in Cornwall, where I specialised in Video Art, Photography and Installations. I did a lot of my work there using AV, Projections in particular, I put on a video art exhibition with other artists at a gallery in Falmouth and throughout my degree collaborated on many AV based art pieces.
I have always been very “techy” and have been building and fixing tech since my early teenage years. After doing my degree I still wanted to be connected to art and culture, but I also wanted to utilise my technical side. So I am incredibly happy that I am part of the Digital Team here at Bristol Culture and able to contribute to the work we do here. So far I and my colleague Steffan, who is also a new Digital Assistant, have been experimenting with ways of auditing and managing all the tech across the Museums. This will allow us to know the specifics of the technology and what tech we have in the galleries and tech available to replace older exhibits and start creating new and improved interactives throughout the next year.
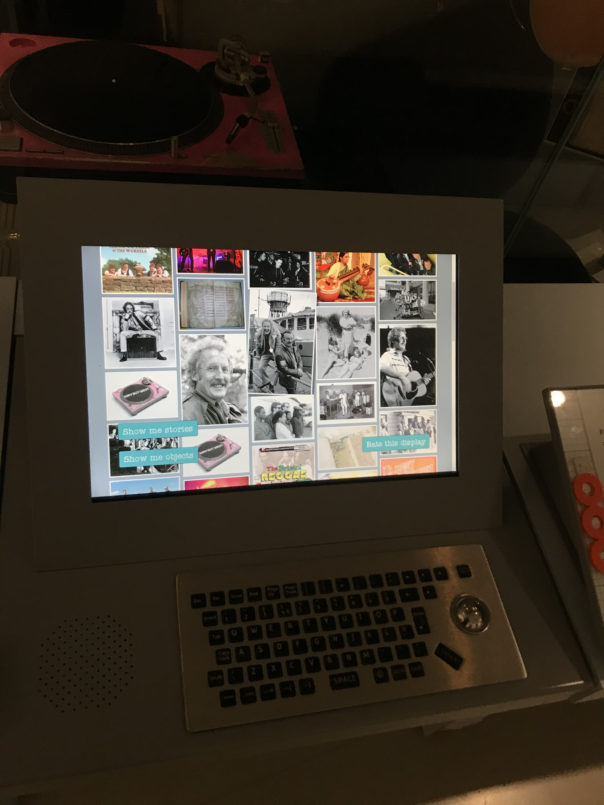
I have been maintaining and fixing the interactives we have at Bristol Museum & Art Gallery, yesterday I helped Zahid, our Content Designer fix a screen in the Magic exhibition gallery which required altering the exhibition structure and threading cables to the screen from above. We are starting to have fewer issues here at Bristol Museum and Art Gallery with interactives, as I’m now here, I’m identifying and solving issues allowing us as a team to have more time to come up with new ideas and improvements and spend less time on maintenance.
I have also been cataloguing interactives we have in the galleries and I am starting to collect content from old interactives so we can begin to refresh old interactives. I have also helped the Curatorial team figure out what technology to purchase or rent for an upcoming exhibit next year, exhibition problem solving is something I’ve always wanted to do in my career so I was very happy to be a part of that process. My experience over the past few weeks here have been great, I have loved helping out and keeping the tech running for visitors, I look forward to more projects in the future and I am very proud to work here.
One of our digital team objectives for this year is to do more with data, to collect, share and use it in order to better understand our audiences, their behaviour and their needs. Online, Google analytics provides us with a huge amount of information on our website visitors, and we are only just beginning to scratch the surface of this powerful tool. But for physical visitors, once they come through our doors their behaviour in our buildings largely remains a mystery. We have automatic people counters that tell us the volume of physical visits, but we don’t know how many of these visitors make their way up to the top floor, how long they stay, and how they spend their time. On a basic level, we would like to know which of our temporary exhibitions on the upper floors drive most traffic, but what further insight could we get from more data?
We provide self complete visitor surveys via ipads in the front hall of our museums, and we can manually watch and record behaviour – but are there opportunities for automated processing and sensors to start collecting this information in a way which we can use and without infringing on people’s privacy? What are the variables that we could monitor?
Hack Time!
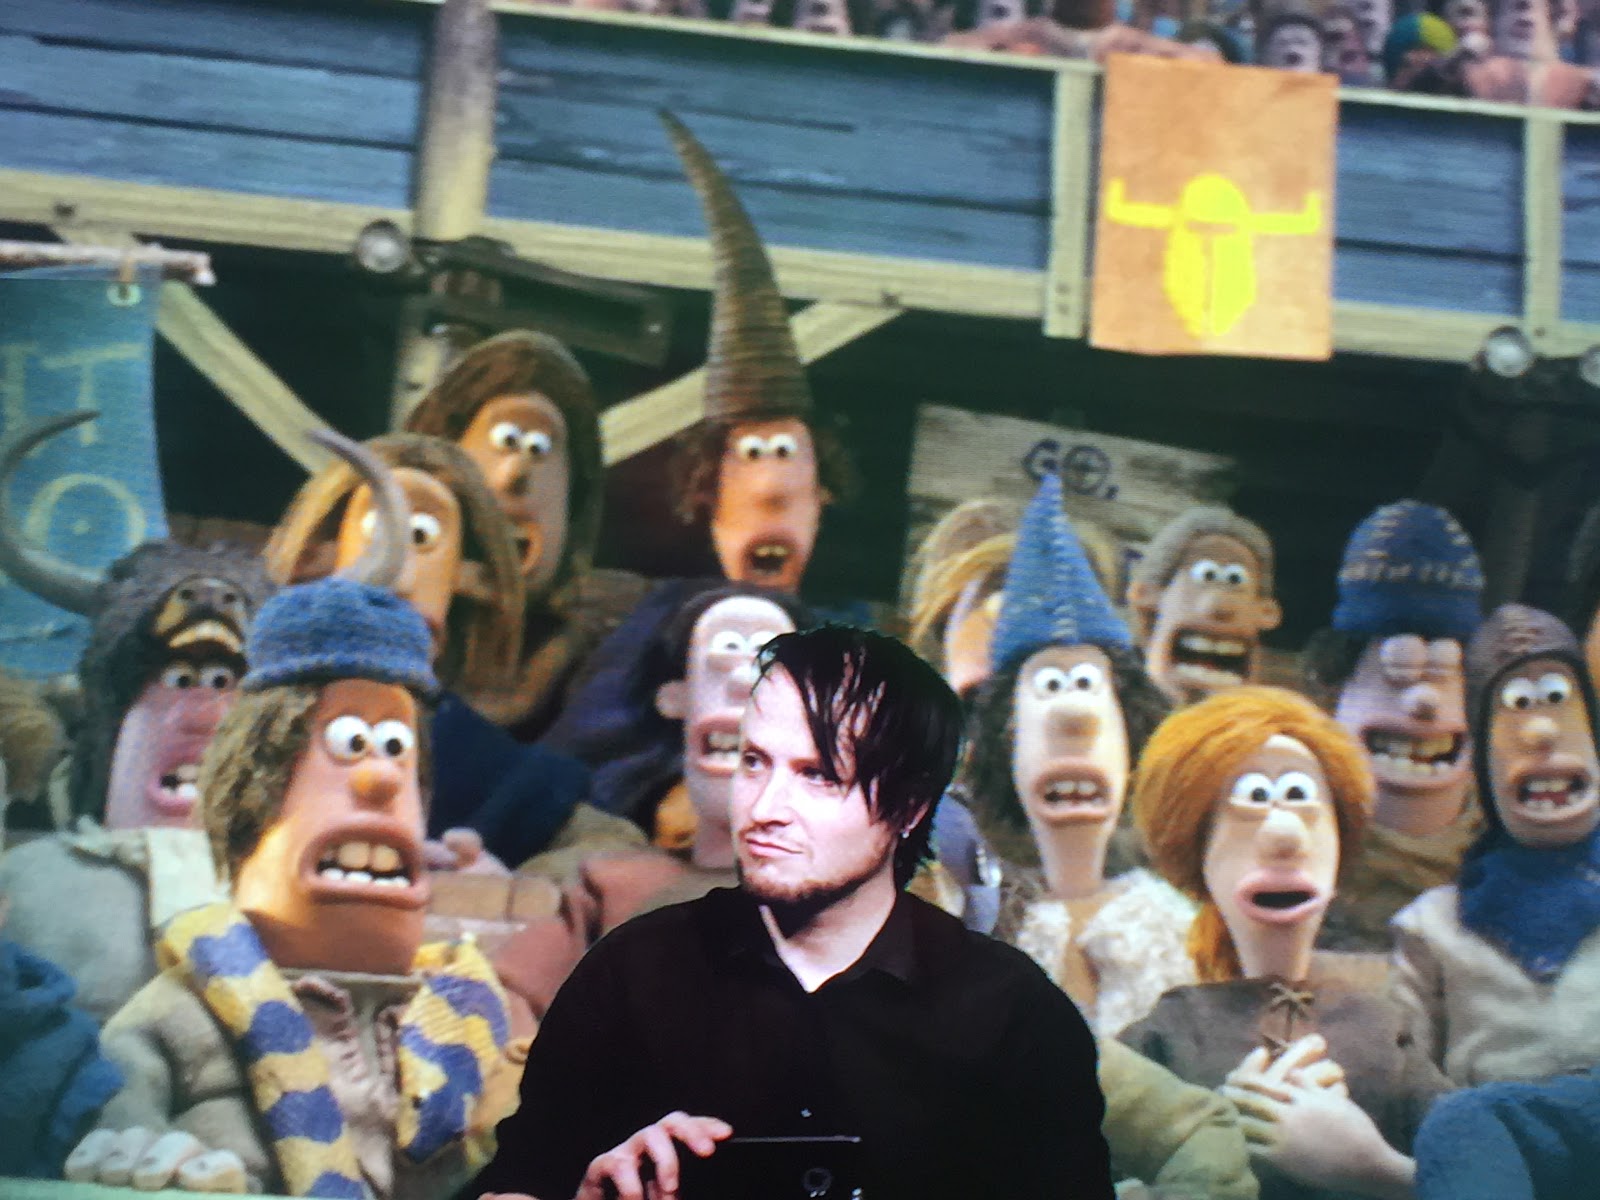
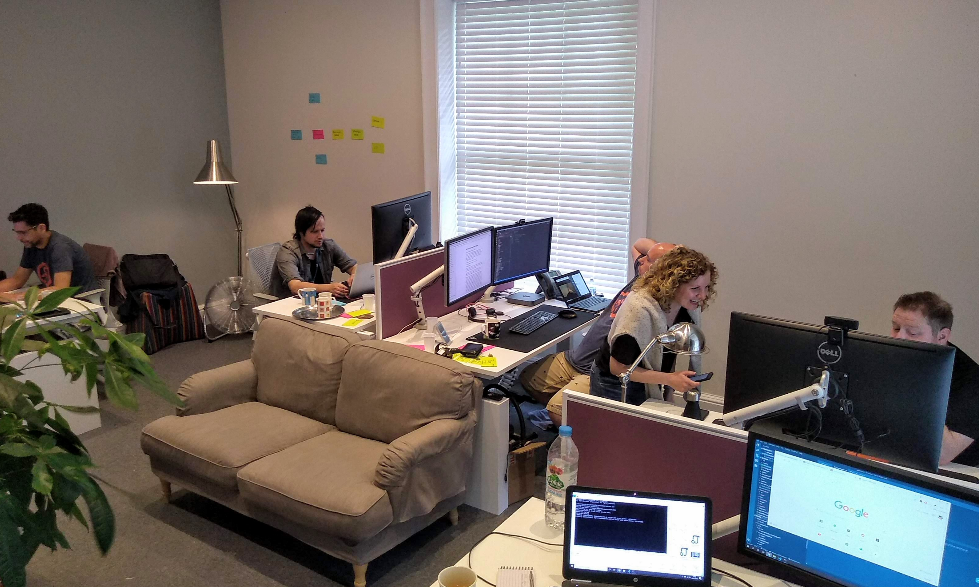
We like to collaborate, and welcome the opportunity to work with technical people to try things out, so the invitation to join the yearly “Lockdown” hack day at Zengenti – a 2 day event where staff form teams to work on non-work related problems. This gave us a good chance to try out some potential solutions to in gallery sensors. Armed with Raspberry Pis, webcams, an array of open source tech (and the obligatory beer) the challenge to come up with a system that can glean useful data about museum visitors at a low cost and using fairly standard infrastructure.
Team:
Atti Munir – Zengenti
Dan Badham – Zengenti
Joe Collins – Zengenti
Ant Doyle – Zengenti
Nic Kilby – Zangenti
Kyle Roberts – Zengenti
Mark Pajak – Bristol Museum
Mission:
Can we build a prototype sensor that can give us useful data on visitor behaviour in our galleries?
What are the variables that we would like to know?
Can AI automate the processing of data to provide us with useful insights?
Given GDPR,what are the privacy considerations?
Is it possible to build a compliant and secure system that provides us with useful data without breaching privacy rights of our visitors?
Face API
The Microsoft Azure Face API is an online “cognitive service” that is capable of detecting and comparing human faces, and returning an image analysis containing data on age, gender, facial features and emotion. This could potentially give us a “happy-o-meter” for an exhibition or something that told us the distribution of ages over time or across different spaces. This sort of information would be useful for evaluating exhibition displays, or when improving how we use internal spaces for the public.
Face detection: finding faces within an image.
Face verification: providing a likeliness that the same face appears in 2 images.
Clearly, there are positive and negative ramifications of this technology as highlighted by Facebook’s use of facial recognition to automatically tag photos, which has raised privacy concerns. The automated one-to-many ‘matching’ of real-time images of people with a curated ‘watchlist’ of facial images is possible with the same technology, but this is not what we are trying to do – we just want anonymised information that can not be related back to any specific person. Whilst hack days are about experimentation and the scope is fairly open to build a rough prototype – we should spend time reviewing how regulations such as GDPR affect this technology because by nature it is a risky area even for purposes of research.
How are museums currently using facial recognition?
Cooper Hewitt Smithsonian Design Museum have used it to create artistic installations using computer analysis of the emotional state of visitors to an exhibit.
GDPR and the collecting and processing of personal data
The general data protection regulations focus on the collection of personal data and how it is stored or processed in some way. It defines the various players as data controllers, data processors and data subjects, giving more rights to subjects about how their personal data is used. The concerns and risks around protecting personal data mean more stringent measures need to be taken when storing or processing it, with some categories of data including biometric data considered to be sensitive and so subject to extra scrutiny.
Personal data could be any data that could be used to uniquely identify a person including name, email address, location, ip address etc, but also photographs containing identifiable faces, and therefore video.
Following GDPR guidelines we have already reviewed how we obtain consent when taking photographs of visitors, either individually or as part of an event. Potentially any system that records or photographs people via webcams will be subject to the same policy – meaning we’d need to get consent – this could cause practical problems for deploying such a system, but the subtleties of precisely how we collect, store and process images are important, particularly when we might be calling upon cloud based services for the image analysis.
In our hypothesised solution, we will be hooking up a webcam to take snapshots of exhibition visitors which will then be presented to the image analysis engine. Since images are considered personal data, we would be classed as data controllers, and anything we do with those images as data processing, even if we are not storing the images locally or in the cloud.
Furthermore – the returned analysis of the images would be classed as biometric data under GDPR and as such we would need explicit consent from visitors to the processing of their images for this specific purpose – non consented biometric processing is not allowed.
We therefore need to be particularly careful in anything we do that might involve images of faces even if we are only converting them to anonymised demographic data without any possibility to trace the data to an individual. The problem also occurs if we want to track the same person across several places – we need to be able to identify the same face in 2 images.
This means that whilst our project may identify the potential of currently available technology to give us useful data – we can’t deploy it in a live environment without consent. Still – we could run an experimental area in the museum where we ask for consent for visitors to be filmed for research purposes, as part of an exhibition. We’d need to assess whether the benefits of the research outweigh the effort of gaining consent.
This raises the question of where security cameras fall under this jurisdiction….time for a quick diversion:
CCTV Cameras
As CCTV involves storing images that can be used to identify people, this comes under GDPR’s definition of personal data and as such we are required to have signage in place to inform people that we are using it, and why – the images can only be captured for this limited and specific purpose (before we start thinking we can hack into the CCTV system for some test data)
Live streaming and photography at events
When we take photographs at events we put up signs saying that we are taking photographs, however whilst UK law allows you to take photos in a public place, passive content may not be acceptable under GDPR when collecting data via image recognition technology.
Gallery interactive displays
Some of our exhibition installationsinvolve live streaming – we installed a cctv camera in front of a greenscreen as part of our Early Man exhibition in order. to superimpose visitors in front of a crowd of prehistoric football supporters from the film. The images are not stored but they are processed on the fly – although it is fairly obvious what the interactive exhibit is doing, should we be asking consent before the visitor approaches the camera, or displaying a privacy notice explaining how we are processing the images?
Any solution that involves hooking up webcams to a network or the internet comes with a risk. For the purposes of this hackday we are going to be using raspberry pi connected to a webcam and using this to analyse the images. If this was to be implemented in the museum we’d need to assess the risk of the devices being intercepted .
Authentication and encryption:
Authentication – restrict data to authorised users – user name and password (i.e. consent given)
Encryption – encoding of the data stream so even if unauthenticated user accesses the stream, they can’t read it without decrypting. E.g. using SSL.
Furthermore – if we are sending personal data for analysis by a service running online, the geographic location of where this processing takes place is important.
“For GDPR purposes, Microsoft is a data processor for the following Cognitive Services, which align to privacy commitments for other Azure services”
Minimum viable product: Connecting the camera server, the face analyser, the monitoring dashboard and the visualisation.
Despite the above practical considerations – the team have cracked on with assembling various parts of the solution – using a webcam linked to a Raspberry Pi to send images to the Azure Face API for analysis. Following on form that some nifty tools in data visualisation, and monitoring dashboard software can help users manage a number of devices and aggregate data from them.
There are some architectural decisions to make around where the various components sit and whether image processing is done locally, on the Pi, or on a virtual server, which could be hosted locally or in the cloud. The low processing power of the Pi could limit our options for local image analysis, but sending the images for remote processing raises privacy considerations.
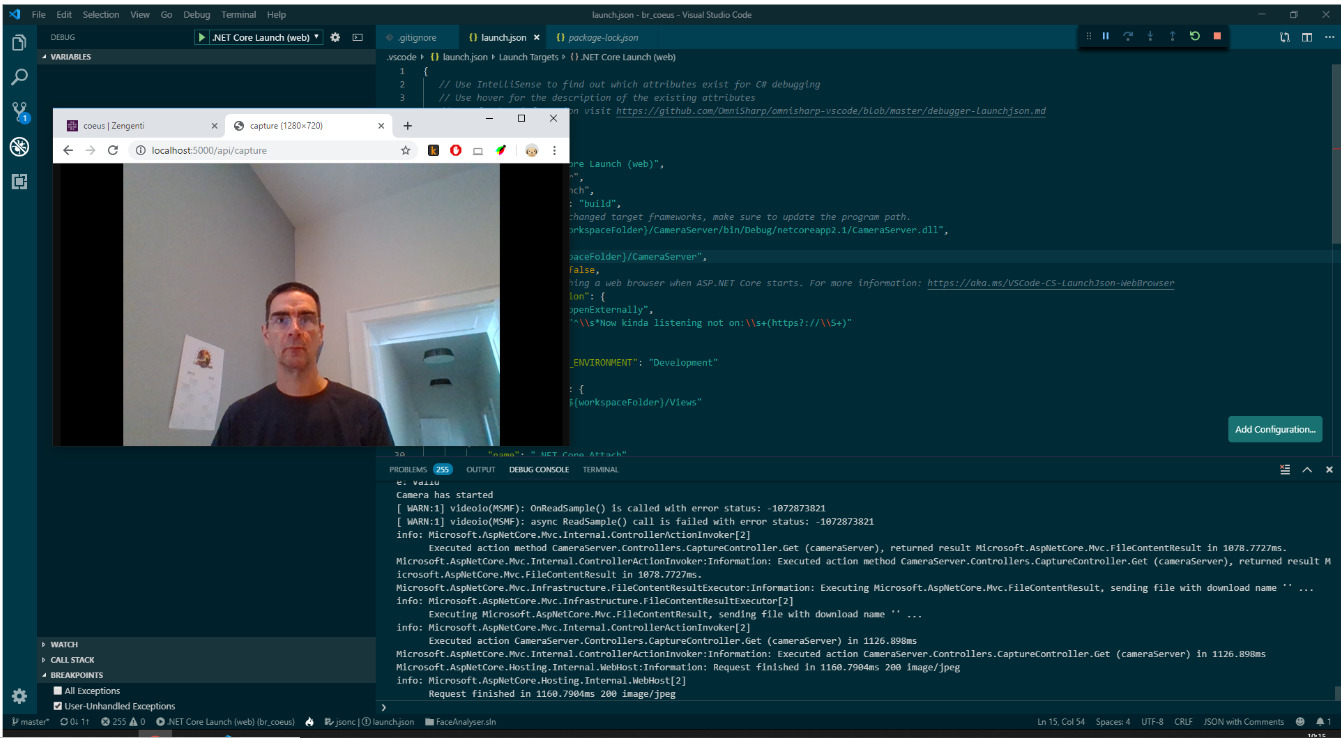
Step 1: Camera server
After much head scratching we had an application that could be launched on PC or linux that could be accessed over http:// to retrieve a shot from any connected webcam – this is the first part of the puzzle sorted.
By the second day we had a series of webcam devices – raspberry Pi, windows PC stick and various laptops all providing pictures from their webcams via via http requests over wifi – so far so good – next steps are how to analyse these multiple images from multiple devices.
Step 2: Face analyser.
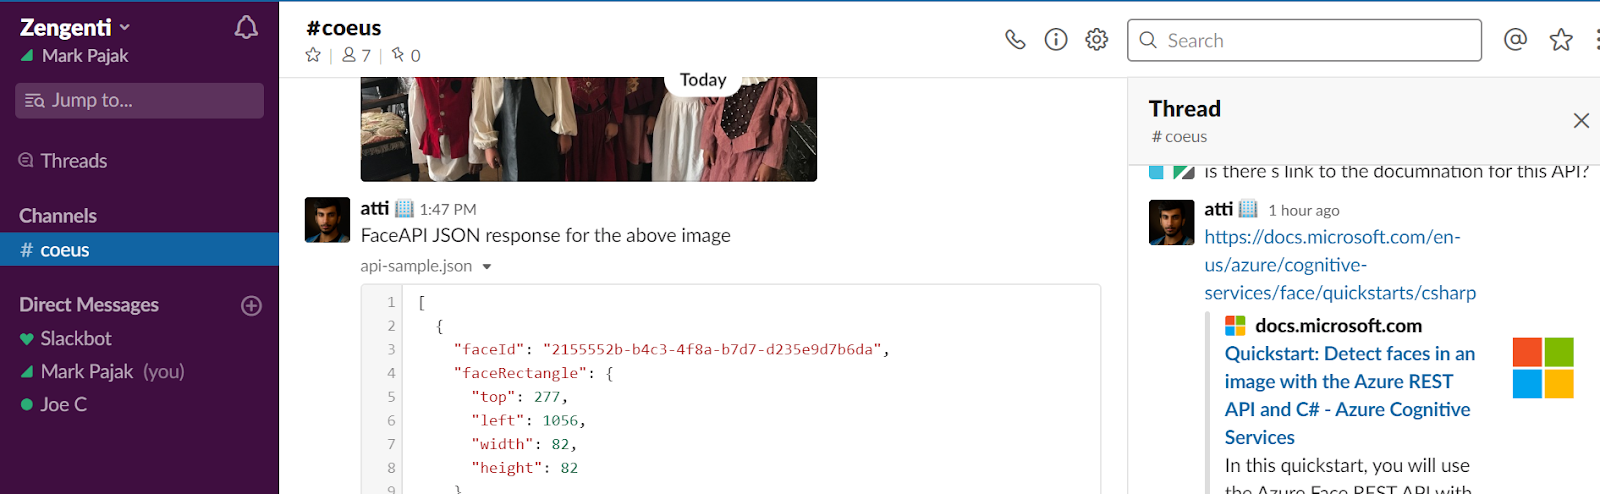
Because the Azure Face API is a chargeable service, we don’t want to waste money by analysing images that don’t contain faces – so we implemented some open source script to first check for any faces. If an image passses the face test – we can then send it for analysis.
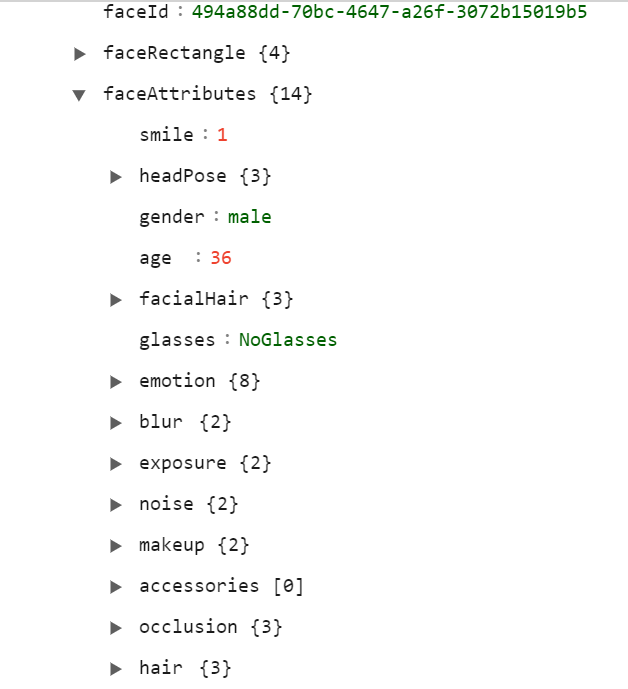
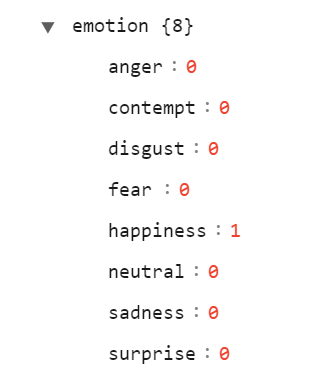
The detailed analysis that is returned in JSON format includes data on age, gender, hair colour and even emotional state of the faces in the picture.
Our first readings are pretty much on point with regards to age when we tested ourselves through our laptop webcams. And seeing the structure of the returned data gives us what we need to start thinking about the potential for visualising this data.
We were intrigued by the faceid code – does this ID relate to an individual person (which would infer the creation of a GDPR-risky person database somewhere), or simply the face within the image, and if we snapped the same people at different intervals, would they count as different people? It turns out the faceid just relates to the face in an individual image, and does not relate to tracking an individual over time – so this looks good as far as GDPR is concerned, but also limits our ability to deduce how many unique visitors we have in a space if we are taking snaphots at regular intervals.
We had originally envisaged that facial analysis of a series of images from webcams could give us metrics on headcount and dwell time. As the technology we are using requires still images captured from a webcam – we would need to take photos on a regular period to get the figures for a day.
Taking a closer look at the “emotion” JSON data reveals a range of emotional states, which when aggregated over time could give us some interesting results and raise more questions – are visitors happier on certain days of the week? Or in some galleries? Is it possible to track the emotion of individuals, albeit anonymously, during their museum experience?
In order to answer this we’d need to save these readings in a database with each recorded against a location for the location and time of day – the number of potential variables are creeping up.
We would also need to do some rigorous testing that the machine readings were reliable – which raises the question about how the Face API is calibrated in the first place…but as this is just an experiment our priority is connecting the various components – fine tuning of the solution is beyond the scope of this hack.
Step 3: Data exporter
Prometheus is the software we are using to record data over time and provide a means to query the data and make it available to incoming requests from a monitoring server. We identified the following variables that we would like to track – both to monitor uptime of each unit and also to give us useful metrics.
Essential
CPU gauge
Memory gauge
Disk Space gauge
Uptime
Uptime (seconds) counter
Services
Coeus_up (0/1) gauge
Exporter_up (0/1) gauge
Face count
current_faces (count) gauge
Face_id (id)
Total_faces (count) summary
Nice to have
Gender
male/female
Gender (0/1) gauge
Age
Age buckets >18 18<>65 <65 histogram
Dwell duration
Seconds
Dwell_duration_seconds gauge
Services
Coeus_up (0/1) gauge
Exporter_up (0/1) gauge
Coeus
API queries
API_calls (count) gauge
API_request_time (seconds) gauge
Exporter
Exporter_scrape_duration_seconds gauge
Step 4: Data dashboard
Every data point carries a timestamp and so this data can be plotted along an axis of time and displayed on a dashboard to give a real time overview of the current situation.
Step 5: Data visualisation
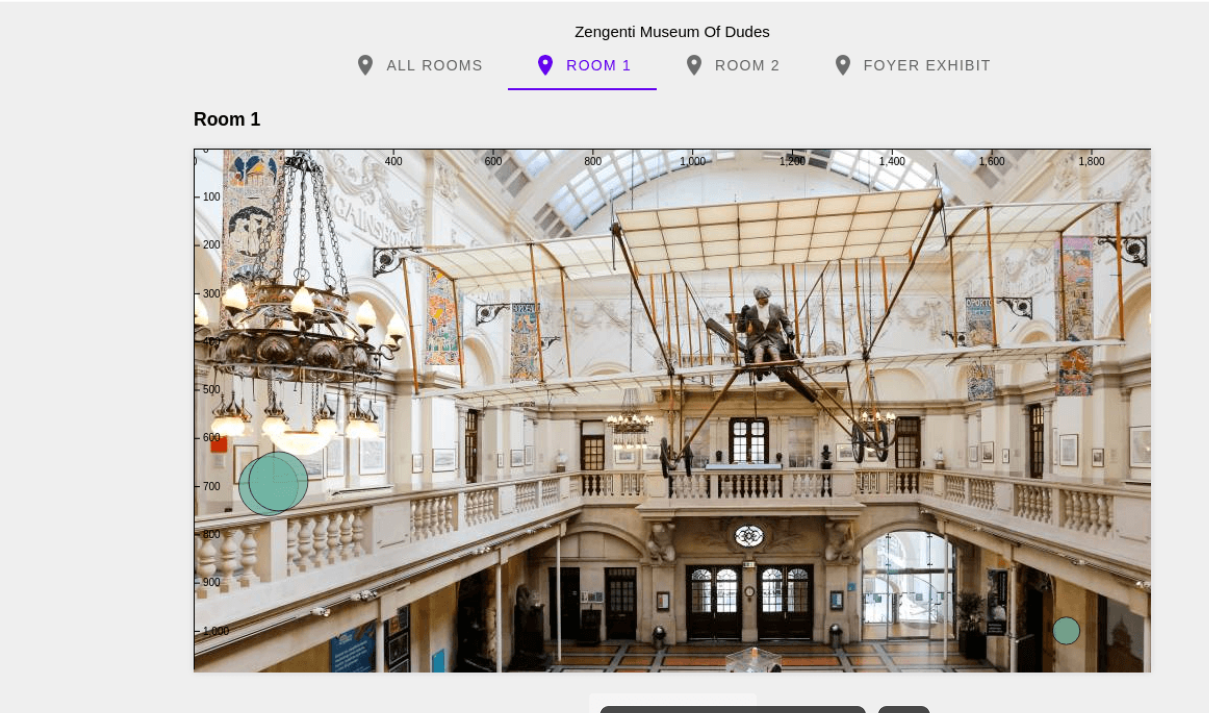
Using D3 we can overlay a graphic representing each face/datapoint back onto the camera feed. In our prototype mock up each face is represented by a shape giving an indication of the ir position within the fame. Upon this we could add colour or icons illustrating any of the available data from the facial analysis.
Slack: we used this for collaboration during the project – great for chat and sharing documents and links, and breakout threads for specific conversations. This became the hive of the project.
Prometheus: monitoring remote hardware
Grafana: open source dashboard software
Azure: image recognition
Codepen:a code playground
D3: visualization library
Final remarks
Our aim was to get all the bits of the solution working together into a minimum viable product – to get readings from the webcam into a dashboard. With multiple devices and operating systems there could be many different approaches to this in terms of deployment methods, network considerations and options for where to host the image processing technology. We also wanted a scalable solution that could be deployed to several webcam units.
Just getting the various pieces of the puzzle working would most likely take up the whole time as we sprinted towards our MVP. As we started getting the data back it was starting to become clear that the analysis of the data would present its own problems, not just for reliability, but how to structure it and what the possibilities are – how to glean a useful insight from the almost endless tranches of timestamped data points that the system could potentially generate, and the associated testing, configuring and calibrating that the finished solution would need.
Whilst the Azure Face API will merrily and endlessly convert webcam screenshots of museum visitors to data points – the problem we face is what to make of this. Could this system count individuals over time, and not just within a picture? It seems that to do this you need an idea of how to identify an individual amongst several screen shots using biometric data, and so this would require a biometric database to be constructed somewhere to tell you if the face is new, or a repeat visitor – not something we would really want to explore given the sensitive nature of this data.
So this leaves us with data that does not resolve to the unique number of people in a space over time, but the number of people in a single moment, which when plotted over time is something like an average – and so our dashboard would feature “the average emotional state over time” or “the average gender”. As the same individual could be snapped in different emotional states.
As ever with analytical systems the learning point here is to decide exactly on what to measure and how to analyse the data before choosing the technology – which is why hackathons are so great because the end product is not business critical and our prototype has given us some food for thought.
With GDPR presenting a barrier for experimenting with the Face API, I wonder whether we might have some fun pointing it at our museum collections to analyse the emotional states of the subjects of our paintings instead?
Bristol City Council publishes many types of raw data to be transparent about the information they hold, and to encourage positive projects based on this data by any citizen or organisation.
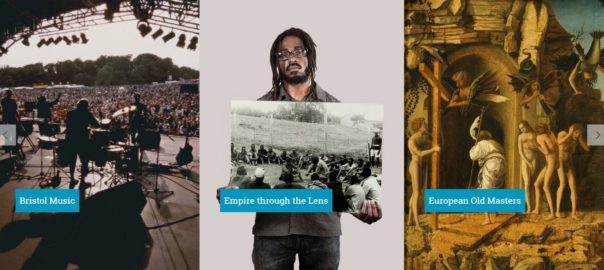
One of the most recent datasets to be published by Bristol Museums is thousands of images from the British Empire and Commonwealth (BEC) collection. You can see a curated selection of these images online “Empire through the Lens”.
At a hackathon hosted by Bristol’s Open Data team with support from the Jean Golding Institute, attendees were encouraged to make use of this new dataset. Our team formed around an idea of using image style transfer, a process of transforming the artistic style of one image based on another using Convolutional Neural Networks.
In layman’s terms this method breaks down images into ‘content’ components and ‘style’ components, then combines them.
We hypothesised there would be value in restyling images from the dataset to draw out themes of Bristol’s economic and cultural history when it comes to Empire and Commonwealth.
The team
Dave Rowe – Development Technical Lead for Bristol City Council and Open Data enthusiast
Junfan Huang – MSc Mathematics of Cybersecurity student in University of Bristol
Mark Pajak – Head of Digital at Bristol City Council Culture Team & Bristol Museums
Rob Griffiths – Bristol resident andArtificial Intelligence Consultant for BJSS in the South West
Aim
To assess the potential of Style Transfer as a technique for bringing attention back to historical images and exploring aspects of their modern relevance.
Method
Natalie Thurlby from the Jean Golding Institute introduced us to a method of style transfer using Lucid, a set of open source tools for working with neural networks. You can view the full Colab notebook we used here.
To start with, we hand-selected images from the collection we thought it would be interesting to transform. We tried to pair each ‘content’ image with ‘style’ images that might draw parallels with Bristol.
Dockside Cranes
A railway steam crane lowers a train engine onto a bogie on the dockside at Kilindini harbour, Mombasa, Kenya.
When we saw this image it immediately made us think of the docks at Bristol harbourside, by the Mshed.
The SS Harmonides which transported the train [likely from Liverpool actually] to Kenya is just visible, docked further along the harbour.
In addition to the images, the data set has keywords and descriptions which provide a useful way to search and filter
We liked this painting by Mark Buck called the Cranes of Bristol Harbour. It says online that Mark studied for a degree in illustration at Bower Ashton Art College in Bristol, not too far from this place.
This image has been created as a result of adding the previous two images into the style tranfer engine.
We drew an obvious parallel here between these two sets of cranes in ports around the world. The Bristol cranes are from the 1950s, but the Kenya photo was taken much earlier, in the 1920s It would be interesting to look more deeply at the cargo flows between these two ports during the 19th century.
Cliftonwood Palace
This is a view of the Victoria Memorial, Kolkata, India in 1921.
It was commissioned by Lord Curzon to commemorate the death of Queen Victoria.
We were struck by the grandeur and formality of the photo.
A photo of the colourful Victorian terraces of Cliftonwood from the river, which have their own sense of formality.
The architectural significance of these buildings in their locales and link to Queen Victoria are small parallels.
It’s funny how the system seemingly tries to reconstruct the grand building using these houses as colourful building blocks, but it ends up making it look like a shanty town.
This image was created by machine intelligence by taking an historical photograph and applying a style gleaned from a bristol cityscape.
Caribbean Carnival
Carnival dancers on Nevis, the island in the Caribbean Sea, in 1965.
Two men perform a carnival dance outdoors, accompanied by a musical band. Both dancers wear crowns adorned with peacock feathers and costumes made from ribbons and scarves.
St Pauls Carnival is an annual African-Caribbean carnival held, usually on the first Saturday of July, in St Pauls, Bristol.
We selected this picture to see how the system would handle the colourful feathers and sequined outfits.
The resulting image (below) was somewhat abstract but we agreed was transformed by the vibrant colours and patterns of movement.
Festival colours reimagine an historical photograph using machine intelligence – but is this a valid interpretation of the past or an abstract and meaningless picture?
After generating many examples we came together to discuss some of the ethical and legal implications of this technique.
We were particularly mindful of the fact that any discussion of Empire and Commonwealth should be treated with sensitivity. For each image, it’s challenging both to appreciate fully the context and not to project novelty or inappropriate meaning onto it.
We wondered whether this form of style transfer with heritage images was an interesting technique for people who have something to say and want an eye-catching way of communicating, but not a technique that should be used lightly – particularly with this dataset.
We often found ourselves coming back to discussions of media rights and intellectual property. None of us have a legal background but we were aware that, while we wanted to acknowledge where we had borrowed other people’s work to perform this experiment, we were generating new works of art – and it was unclear where the ownership lay.
Service Design
We set out potential benefits of our service:
A hosted online service to make it a more efficient process
Advice and tips on how to calibrate and get the best results from Style Transfer
Ability to process images in bulk
Interactive ways of browsing the dataset
Communication tools for publishing and sharing results
Interfaces for public engagement with the tool – a Twitter conversational bot
On the first day we started putting together ideas for how a web service might be used to take source images from the Open Data Platform and automate the style stransfer process.
This caused us to think about potential users of the system and what debate might be sparked fromt he resulting images.
Proposition Design
A key requirement for all users would be the ability to explore and see the photographs in their original digitised form, with the available descriptions and other metadata. Those particularly interested in exploring the underlying data would appreciate having search and filter facilities that made use of fields such as location, date, and descriptions.
We would also need a simple way of choosing a set of photographs, without getting in the way of being able to continue to discover other photos. A bit like in an online shopping scenario where you add items to a basket.
The users could then choose a style to apply to their chosen photos. This would be a selection of Bristol artworks, or iconic scenes. For those wanting to apply their own style (artists, for example) we would give an option to upload their own artwork and images.
Depending on processing power, we know that such an online service could have difficulty applying style transforms in an appropriate time for people to wait. If the waiting time were over a couple of minutes it could be that the results are provided by email.
Components
Spin off products…Topic Modelling
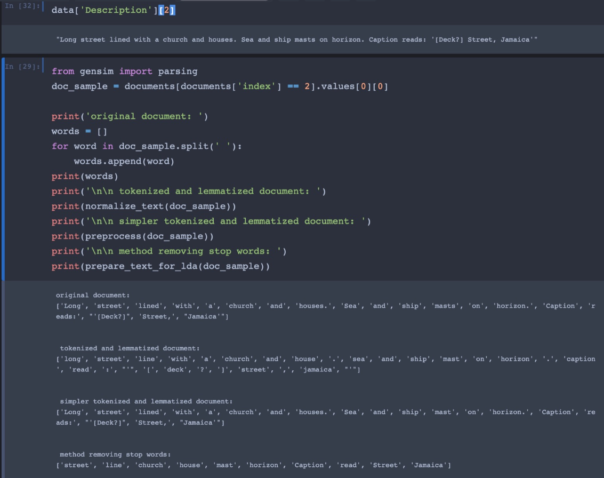
We even successfully built a crucial component of our future service. The metadata surrounding the images includes both keywords and descriptive text. Junfan developed a script that analysed the metadata to provide a better understanding of the range of keywords that could be used to interrogate the images. This could potentially be used in the application to enable browsing by subject….
We wanted to generate a list of keywords from the long form text captions that accompanied the images. This would allow us to come up with a classification for pictures using their description. Then, users would be able to select topics and get some pictures they want.
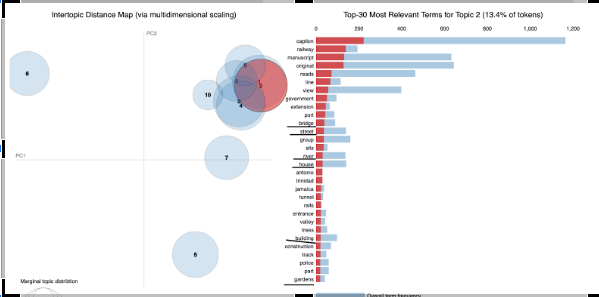
Here in topic 2, our model has added bridge, street, river, house, gardens and some similar words into the same group.
Python is the language of choice for this particular applicationTopic modelling reveals patterns of keyword abundance amongst the captionskeywords extracted from the captions can help us build an interface to allow filtering on a theme
Reflections
After generating many examples we came together to discuss some of the ethical and legal implications of this technique.
We were particularly mindful of the fact that any discussion of Empire and Commonwealth should be treated with sensitivity. For each image, it’s challenging both to appreciate fully the context and not to project novelty or inappropriate meaning onto it.
We wondered whether this form of style transfer with heritage images was an interesting technique for people who have something to say and want an eye-catching way of communicating, but not a technique that should be used lightly – particularly with this dataset.
We often found ourselves coming back to discussions of media rights and intellectual property. None of us have a legal background but we were aware that, while we wanted to acknowledge where we had borrowed other people’s work to perform this experiment, we were generating new works of art – and it was unclear where the ownership lay.
Does this have potential?
We thought, on balance, yes this was an interesting technique for both artistic historians and artists interested in history.
We imagined their needs using the following user personas:
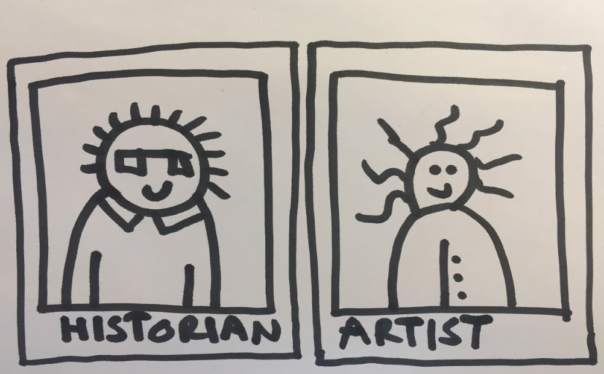
Artistic Historians: ‘I want to explore the stories behind these images and bring them to life in a contemporary way for my audience.’
Artists interested in history: ‘I want a creative tool to provide inspiration and see what my own personal, artistic style would look like applied to heritage images’.
We spent time scoping ways we could turn our work so far into a service to support these user groups.
References & Links
The repo for our application: https://github.com/xihajun/Art-vs-History-Open-Data-Hackathon-Code
Open data platform:https://opendata.bristol.gov.uk/pages/homepage/
Bristol Archives (British Empire and Commonwealth Collection): https://www.bristolmuseums.org.uk/bristol-archives/whats-at/our-collections/
Acknowledgements
Thanks to Bristol Open for co-ordinating the Hackathon.
Thanks to Lucid contributors for developing the Style Transfer code.
Thanks to the following artists for source artwork:
Mark Buck: https://www.painters-online.co.uk/artist/markbuck
Hi, my name is Hannah Boast and I am an apprentice working in the City Innovation Team for Bristol City Council. Our aim as a team is to create a smarter digital future for Bristol. A wide range of projects are currently being worked on by the City Innovation team such as driverless cars, smart homes and ultrafast broadband. A project I would like to elaborate on which our team is also involved in is maintaining and promoting the Open Data platform.
Bristol’s open data platform’s objective is to have accessible data that is widely available to the public and to organisations. By increasing data transparency it can open opportunities for discovering new insights of the city and support our digital economy. Successfully we have recently been co-ordinating data hackathons and data jams which involve gathering people who collaboratively code over a short period of time. During this attendees will be working on a particular project and the idea is for the teams to have the ability and freedom to work on whatever he/she wants. These engagements run along with contributing partners such as organisations and the data community. The data engagements can help us understand the aims of the interested public in open data and bringing in a new generation of people who can help drive and contribute to open data in Bristol. Keep up to date on any upcoming events on our Connecting Bristol website.
Bristol Museum & Art gallery are currently digitalising their collection of artefacts to make it accessible to a wide range of people online. A great example is The Natural History Museum data portal it has uploaded a great deal of the museums artefacts. This gives the public access to find out more detailed information on what is held at the museum.
Get in contact with us to find out more on open data in Bristol: opendata@bristol.gov.uk
Over the next few weeks we are running user testing of SMARTIFY at M Shed. This app provides visitors with extra information about museum objects using image recognition to trigger the content on a mobile device.
To install the free app use this link: https://smartify.org/
If you have used the app at M Shed, please could you take a few moments to complete the following survey: https://www.surveymonkey.co.uk/r/ZVTVPW9
If you would like to help further, please get in touch with our volunteer co-ordinator: https://www.bristolmuseums.org.uk/jobs-volunteering/
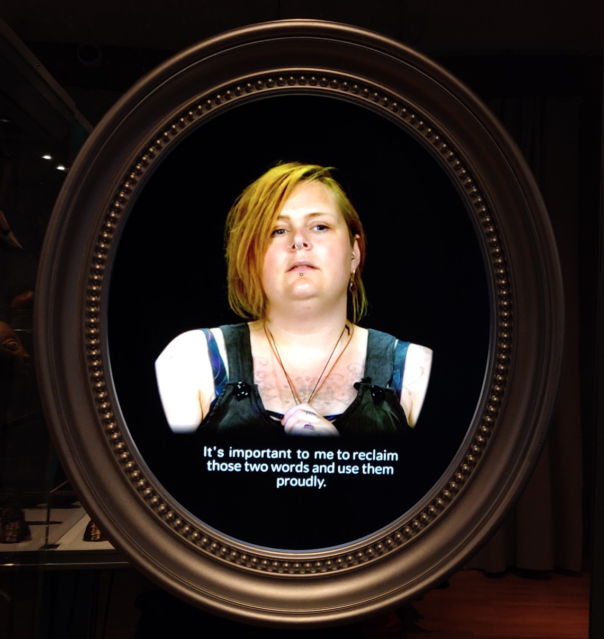
This is an Interview with Tom Marshman about an alternative audio tour available at M Shed
Q: Can you describe the new resource you have created?
A: Working together with Rowan Evans (sound artist) we have created an alternative audio tour of the M-shed.
The tour connects up some of the stories I have collected for my performance work within the exhibition about Bristol, sharing stories I heard when interviewing older LGBT people in Bristol about the stories that lie at the roots of their LGBT identity.
The stories are funny and touching, and I’ve presented them very lyrically so the tour almost becomes a long poem that moves you around the first and ground floors of the M-shed.
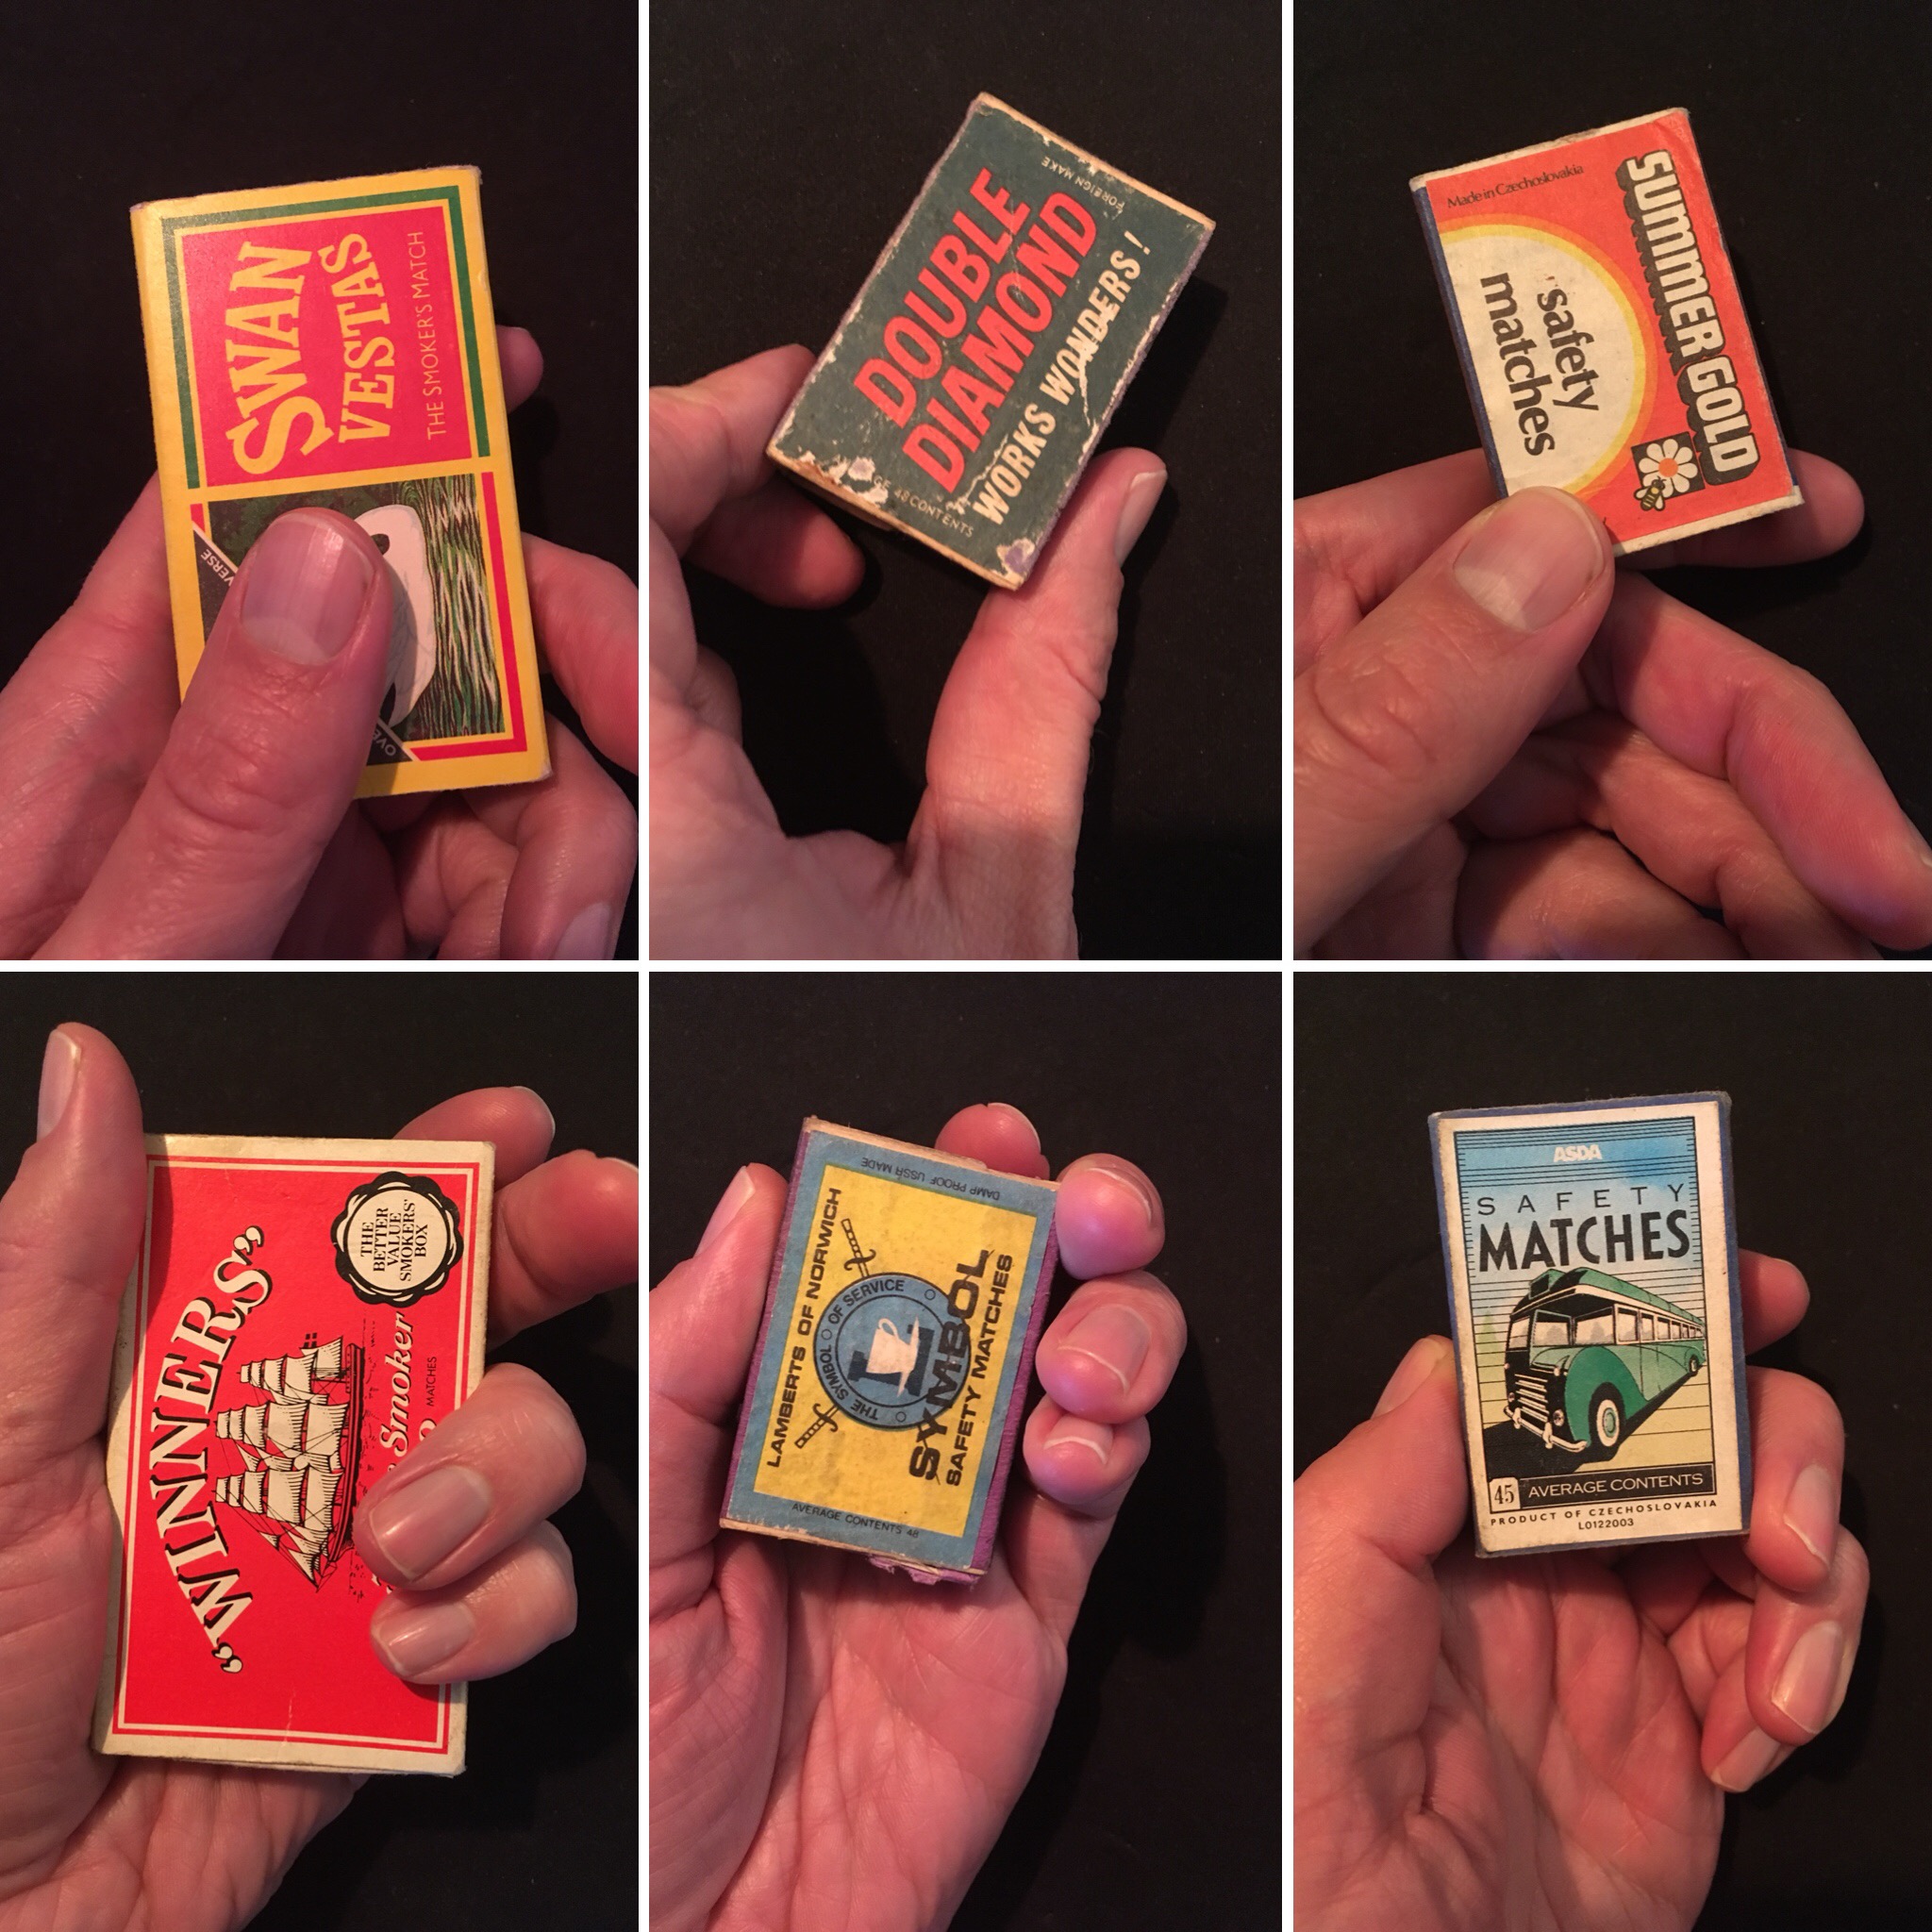
If you would like to do the tour the audio devices are kept behind the information desk on the ground floor, all you need to do is ask for one from a member of staff. The audio devices are encased in vintage matches, so you collect your headphones and match box and move around the space.
The piece was originally a live performance walk around the old city, around St Nicholas market so a lot of the stories are based there, most significantly the Radnor Hotel, which was a known gay venue from the 1930’s onwards.
Q: What is it about audio that made you decide to use this medium?
A: Each story is represented by the sound of a match striking; the stories burn brightly and quickly like a match, sharing a story before you move on to the next story. The idea for this came from one particular story where a man met his life partner by being asked for a light.
I really wanted people to feel like they were heading back in time with this work and that there was a retro vibe going on. I didn’t want them walking around the galleries with cutting edge technology I wanted something more tactile and evocative of stories people tell, this is why I chose the matchbox.
Q: How does your product differ from a usual museum audio guide?
A: In my work I am not so concerned with facts and figures, what I want to do is tell a good story and in particular the stories of older LGBT people which could soon be lost.
I think they add a new texture to the exhibits in the M Shed, bringing out the human stories within the objects and focusing on LGBT stories. LGBT stories are often whitewashed in museum versions of history, where we told the stories of the ‘powerful white upper class men’ instead. This work, I think, helps address this imbalance, and adds a new range of stories so that M Shed represents the diverse and exciting Bristol we live in.
These are stories I think everyone will enjoy hearing the stories, although some of the language is a bit racy so over 16’s only!
Q: Do you think the technology presents any barriers to access?
A: As an artist I’m based at the Pervasive Media Studio within Watershed Cinema where many artists and technologists are exploring ways to work with technology in new and exciting ways.
Amusingly, I am a technophobe, so for me to understand it, it has to be very simple. Because of this, what we have created is super easy to use, the only thing you have to do is turn it on, find the right volume, and follow the directions of where to move to within the audio tour. If people have smartphones they can also request a link or scan a QR code, to find the tour online. So technically they don’t need to have the matchbox, but I feel that spoils the fun slightly!
The important thing for me, when I am working with technology, is that it doesn’t get in the way of the stories and that the technology supports it, rather than presenting a barrier. And if anyone finds any teething problems, then I hope they’d mention it to the information desk so we can improve accessibility.
Q: How do you think the museum could learn from this project when developing their own audio resources?
A: The M-shed is not just about Bristol as a place, it’s also about the people of Bristol. And I love that it places importance on a wide-range of people too, not just people that are deemed to be ‘the great and the good’. I think our project reinforces that and tells us about a group of people whom you don’t often hear about.
I hope adding this will bring new LGBT audiences into museums to connect them to our history, as well as introducing non-LGBT museum-goers to it, all in an engaging and fun way.
As an artist I love working in museums because they are rich in stories, and I think it’s important to find new ways to share and celebrate within the museums.
Move Over Darling talks about people’s lives, deaths, loves, friendships and sex lives in a way that many museums don’t. The way our society treated LGBT people up until very recently has become a shocking and shameful secret history, and projects like this one can help museums tackle these difficult issues as well making sure the positive stories of LGBT people are not lost.
There’s a personable quality to the work I make too. All the people I tell my stories about on the audio tour I have met, I know them and we have exchanged our stories in face-to-face conversation. Though you don’t get to hear my stories on the tour, the human exchange during this research has indelibly influenced and shaped how I tell these stories. Sadly a big contributor to the content passed away last year, it is nice that his stories are present in the museum in this way.
Q: How can people access the content?
A: You can collect the matchboxes from the front desk at the M-shed anytime they are open, you can also find it online here and listen as you walk around the museums.
This is an ongoing part of the exhibition so hopefully my voice will be in the museum forever or at least until it doesn’t feel relevant anymore. Perhaps in a few years I will add more stories, we’ll see!
A place to translate our in-house exhibitions for an online audience, we worked with Mike and Luke at Thirty8 Digital to create a narrative structure with scroll-through content and click-through chapters on WordPress. They built in lovely features such as object grids, timelines, slideshows, maps and quotes.
There are a few exhibitions already up, past (death: the human experience) present (Empire through the Lens) and future (What isBristol Music?). We’ve most recently used it for our European Old Masters gallery to showcase a beautiful painting we have on loan for two years: St Luke Drawing the Virgin and Child by Dieric Bouts (I discovered the Pantone app with this one, taking the red from the gallery to use online. V satisfying). I’m currently working with the exhibition team to get our Pliosaurus! exhibition up – watch this space for some fun things with that one, which we’re hoping to use for interp in our Sea Dragons gallery at Bristol Museum & Art Gallery too.
(For the What is Bristol Music? exhibition opening in May 2018, we’re using WP plugin Gravity Forms to collate peoples’ experiences and pictures of the Bristol music scene to be featured in the physical exhibition. Chip in if you have a story to tell.)
So far, we’ve found the content and arrangement really depends on the exhibition. The idea isn’t to simply put the physical exhibition online (I say ‘simply’, as if it would be) but instead to use the format and content of the exhibition to engage with people in a different environment: albeit one where we’re competing with a thousand other things for people’s attention. Exhibitions which have been and gone have been slightly more challenging, as the content was never intended for this use and has needed some wrangling. The more we use it though the smoother the process is getting, now that we know what we need and it being on teams’ plans as something to consider.
We’re still in the early stages of reviewing analytics to see how people are using it. Initial results are heartening, though, with a few thousand visits having had minimal promotion. At the moment most people are finding it from our what’s on pages (where most of our traffic to the main website is anyway) and we’re thinking about what campaigns we can do to get it out there more.
We are currently uni students at UWE (University of the West of England) studying history with heritage as the first students on this programme of study. We have been given the fantastic opportunity to work with the digital department at Bristol Culture which runs the various museums and heritage sites in and around Bristol as its first digital curating internship. These fully compliment what we have been and continue to study within our degrees and will allow us to put into practical use what we have studied.
Over the course of the next eight weeks will be working alongside various different departments, collections and projects, offering us a unique insight into the heritage industry.
What does digital curating mean to us?
For us digital curation is the future of 21st century museology the implementation and development of which allows for four significant benefits:
• Democratisation of information reduces barriers to entry.
• Increases the potential use of collections.
• Stimulates further research.
• Widens community engagement to ever greater and diverse audiences.
As fantastic as these systems can be there is still room for further advancement. We have already learnt in our short time here that a few issues include inconsistencies across departments, collection backlog, dirty data also the lack of secure data sharing detailed information between institutions. Despite these hurdles the drive to expand and improve digital curation continues with great hope for what can be achieved in this field.
Expectations for the role:
Through this role we aim to:
• Engage and critique existing cataloguing methods and SPECTRUM standard archival systems such as EMu.
• To develop strategies for increasing engagement with both collections and institutions.
• Develop the necessary skills and experience to pursue a career within the heritage industry.
• Work closely and network with a variety of different heritage professionals within the South West.
We both look forward to expanding both our knowledge and experience, as well as eagerly anticipating what this internship has in store for the next eight week’s .
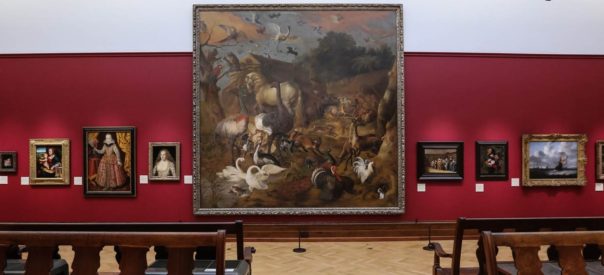
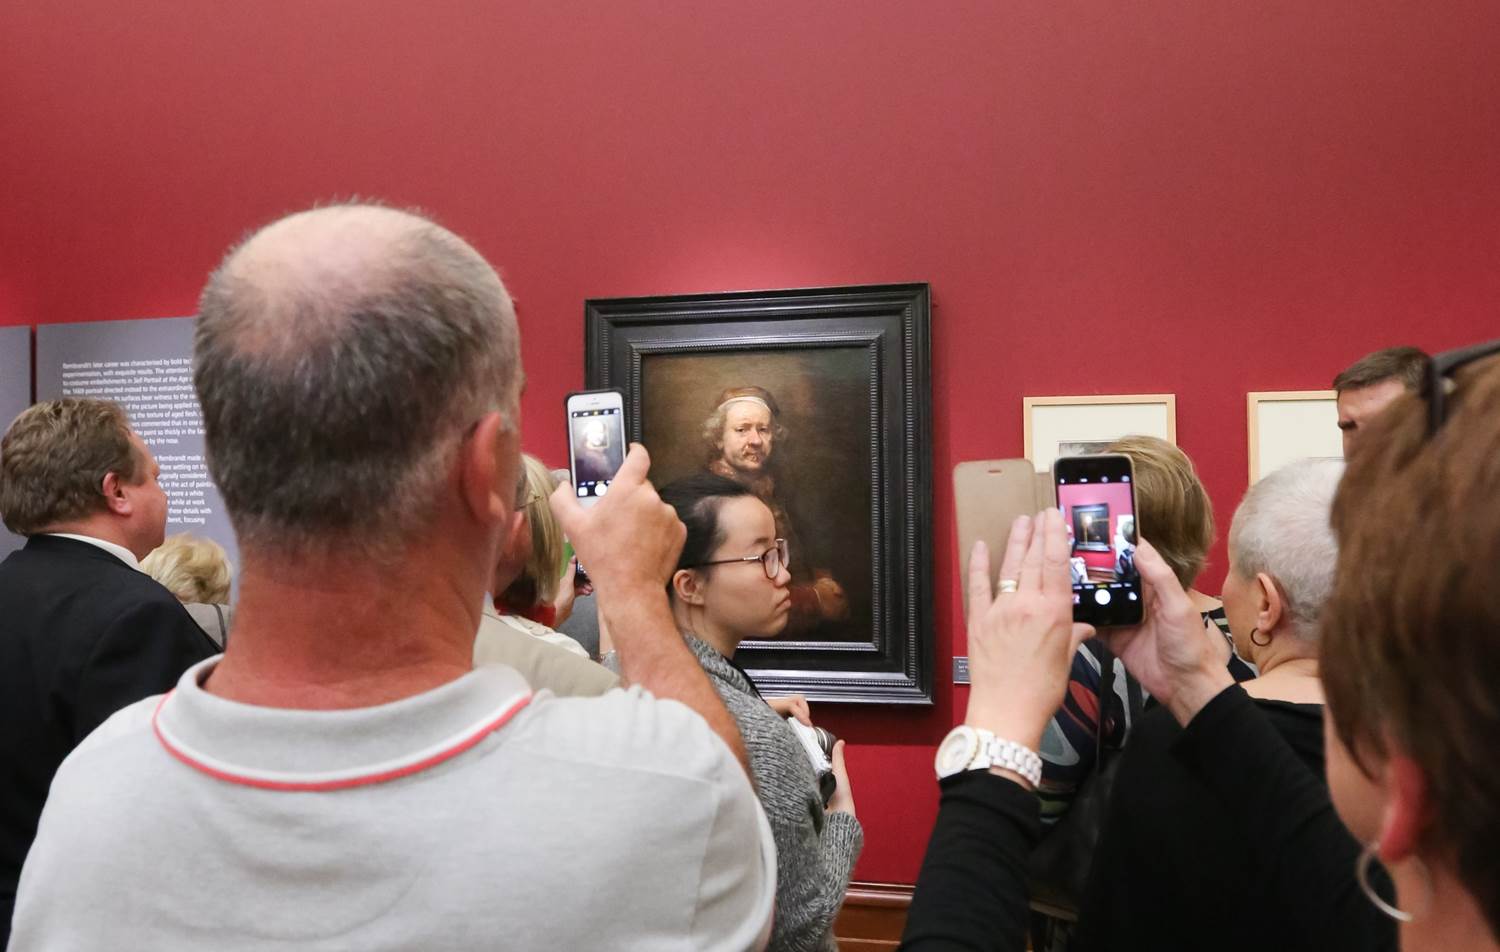
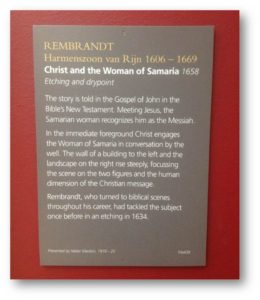
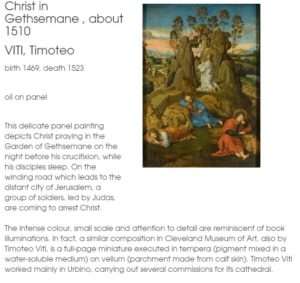
At Bristol Museums we use EMu to manage digital interpretation, and have several galleries with touchscreen kiosks displaying object narratives. We haven’t yet settled on a single technology, framework or data model as each new project gives us opportunities to test out new ideas, based on what our audiences want and on our previous learning. The refurbishment of our European Old Masters Gallery has given us the opportunity to extend the printed interpretation into digital.
(C) John Seaman, Bristol Culture
The classic look of the gallery means label space is kept to a minimum, and this had reduced the amount of printed interpretation available on the physical labels. Digital gives our curators the opportunity to expand on the depth of interpretation by writing more detailed descriptions of paintings. Our challenge was to come up with a solution that provided in-gallery mobile digital interpretation that was easy to access and fast to load, and that made sense in context.
Taking a user-focused approach, we were keen to provide appropriate technology to the sorts of visitors to the gallery. Our audience research shows that mobile technology is a standard anong these visitors, as explained by Darren Roberts, our user researcher.
Our Audience segmentation shows that three of the Core Audience Segments for Rembrandt – City Sophisticates, Career Climbers, and Students – are all over 20% more likely than average visitors to use their mobile phone to access educational web content or apps. All three groups are also over 20% more likely than average to agree with the statement ‘I couldn’t live without the internet on my mobile’. These three segments account for over a third of the general audience for the museum.
Ranked in order of segments that are both most likely to have an interest in Antiques and Fine Art and use their mobile phone to access free educational content or apps:
Student Life
Lavish Lifestyles
City Sophisticates
Career Climbers
Executive Wealth
The top three are over 40% more likely than average visitors to engage in both these activities. All five are expected to be part of the core audience for the Rembrandt exhibition.
With this in mind, we set about analysing the printed labels – looking at where data could be brought in from our collections management system (EMu) automatically to minimise effort in writing content. As it turns out we already had most of this data (artist name, birth date, death date etc.) and so the main curatorial effort could be focused on text wiring for the labels, while we designed the template to bring the data together.
Thanks to some preliminary experiments, we already had a working framework to use – we are using AngularJS on the client side for rapid prototyping, templating, routing and deployment.
Our next challenge was to optimise performance and maximise up-time. Having been inspired by the linked open data movement, we opted for having the data sit in structured JSON files that could be reused multiple times by various apps without querying the database directly. This had the double effect of reliability and speed. We did a similar thing with multimedia, running a regular content refresh cycle and packing everything up for the app to use, with images saved at sizes for thumbnail and detail views.
The finished template was as follows – we opted for a minimalist design for east of reading, and with responsive elements the pages work across multiple devices.
The process of selecting source fields and mapping them to the template has inevitably thrown up areas where our database use could be improved, and where before we had data across many fields, now we have laid out better guidelines for object cataloguing that should ease this issue – for the app to work we needed set fields to extract information about the painting and artists.
We also had to deal with inconsistencies in terminology, for example the various ways dates could be written – on printed labels these variations are permitted, but we need to define the semantic patterns in order for this to work in digital. Now we have a workflow for improving the way we catalogue our objects as a result of this process.
Where some terms were abbreviated on the labels e.g “b” and”d” for birth and death – we expanded these on the digital labels as space was not an issue and we also felt this was easier for users to read and understand – digital allows us to implement some of our user focused principles without disrupting the printed gallery interpretation.
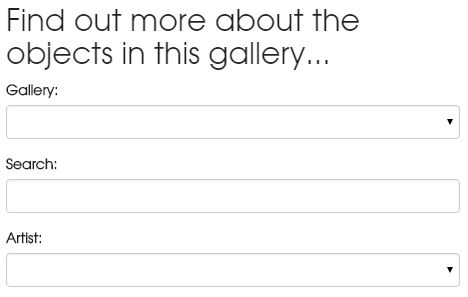
Through in-gallery user testing we found that whilst some features were obvious to us, visitors were not always getting to the bits we wanted them to see – we therefore added a call to action to make it clear what was available…
“Find out more about the objects in this gallery”
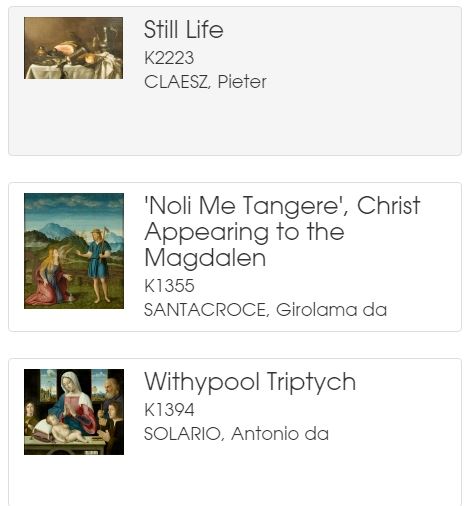
Something we are interested in finding out is how users navigate to their chosen painting. User stories and personas are one method we could use to get a better understanding of this. To facilitate various user journeys, we provide different routes to each digital label, either by searching by painting name, filtering on the artist’s name, or through browsing through the list view.
Technical details:
The routing mechanism of AngularJS gave us a simple way to navigate through from the list view to the record view by altering the # parameter as follows:
We also included some libraries for smooth page loading to improve the user experience. At this stage we don’t know whether the digital labels have a use outside the gallery, but in case the do we wanted the pictures to be zoomable, and there was a code library that allows this. N.B. this is not yet deep zoomable, but we are on the road to achieving that.
Data stuff
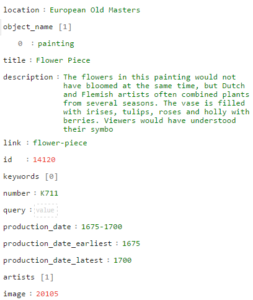
We want to be able to reuse our structured data on paintings and artists and their info and dates whenever new technology comes along, and so our data layer exists independently of the application, and it also sits outside our database on a publicly accessible endpoint. If you want to use any of it, in JSON form you can take a look here:
We store lists of objects in separate index.json files here:
museums.bristol.gov.uk/labels/data
And for details info about an object you can load up records by their id here:
museums.bristol.gov.uk/labels/id
Structures and paths may change as we develop the system so apologies if these are not accessible at any point. We change bits in order to improve issues with loading time and reliability, but we aim to resolve this to a standard approach to our data layer with time.
We are also figuring out what structure out object (json) records need to contain in order to maximise their use outside of our collection management system. Where dates and places exist in several source fields, we can prioritise these on export to choose which dates are most suitable, and similarly for places.
We construct a standard object schema in JSON as a result of a scheduled content refresh script which queries the IMu api, prioritises which fields to include the and saves as a JSON…
Next steps
We have implemented this in one gallery so far, and for one object type. We are now looking to roll this out to other galleries and look forward to similar challenges with different types of objects.
We are also extending the design of the prototype to bring in timelines and mapping functionality. These bring an interactive element to the experience and also provide new ways of visualising objects in time and space.
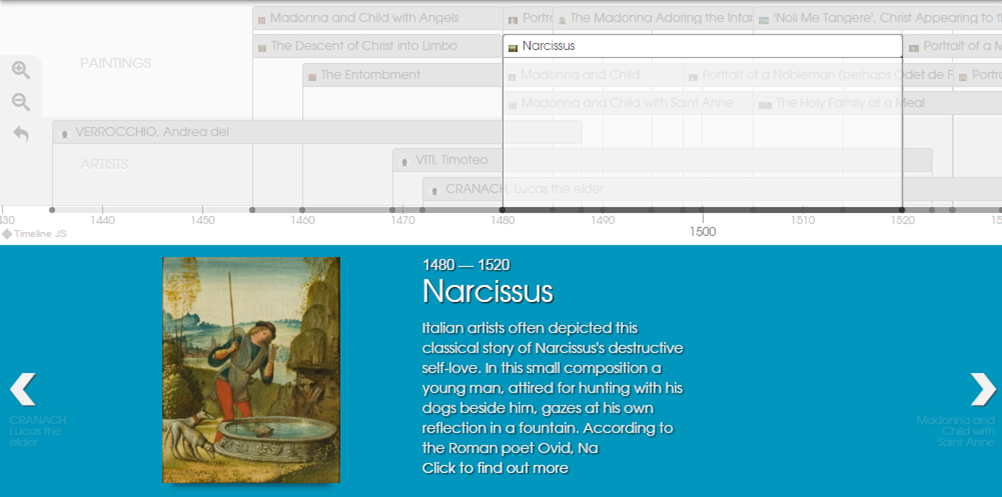
We included the TimelineJS3 library into our framework, and hooked it up to the same data powering the object labels. This provides a comparison of artists’ lives with each other, and with the paintings they produced.
We need to tweak the css a little, but out of the box it works well, thanks to the kind people at Knightlab.
The project has made us rethink some of our cataloging standards – we are aligning our internal data capture and export to be better equipped to make use of new web tools for public engagement.
We have decoupled the tasks of writing label text, and reusing object data and applying narrative metadata. We also have a process that would allow new layers of interpretation to be written and published to the same application architecture, and we can present a simplified data entry process to staff for this label writing process.
Although we haven’t solved the problem of how to improve uptake of the application in-gallery, we’ll be ready when someone does. If its ibeacons that do it – and we think it might be, we can direct users to a single object label using a unique url to our digital label.
For now though it is just a trusty old url to point people to the page where they then navigate further, but we’d love to remove this barrier at some point.