A bit about me
I’m Lillian Robertson, a final year undergraduate student studying Sociology at the University of Bristol. I landed this User Research Internship under a University of Bristol Q-step Internship, a sponsored scheme designed for social science students to gain experience of working with real-world data to develop their quantitative research skills. Being that I only had experience of working with data in an educational setting, I was keen to do this internship to broaden my data collection, analysis and reporting skills. Having limited knowledge about digitally assessing and presenting data, I was also excited to take on the challenge.
Getting started and Identifying the issues
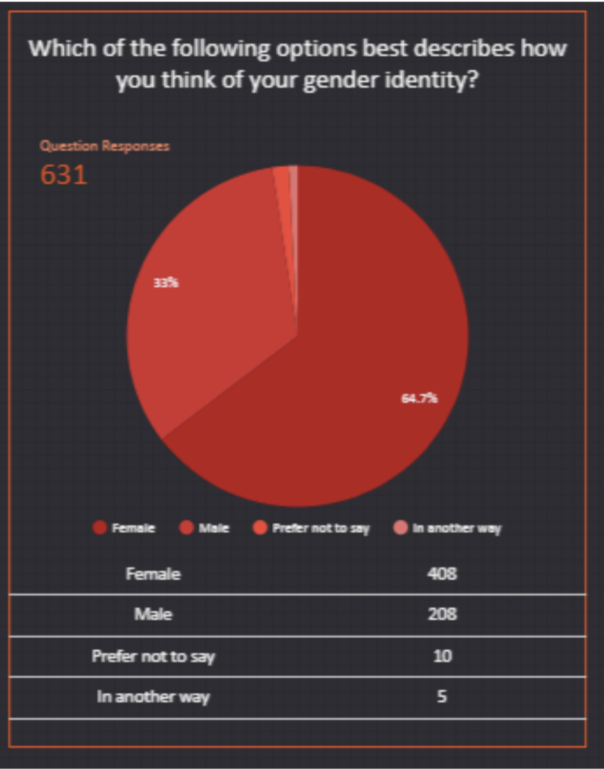
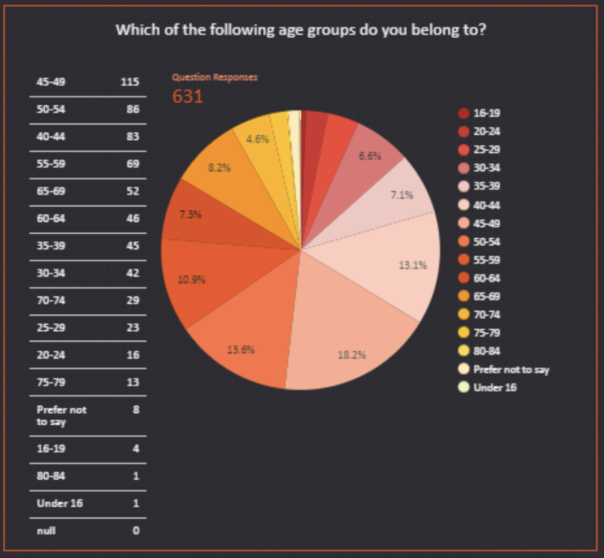
After a few set-backs and delays due to tightening covid restrictions, I began this project at the beginning of February. We laid out a 2-month timeline and started to identify issues with the current methods of visitor data collection that Bristol Museums use: emailed self-completion surveys (ESCS) and tablet self-completion surveys (TSCS). In terms of demographics, the data appeared to skewed, with visitor demographics not matching anecdotal evidence given by front-of-house (FOH) staff. Taking the Vanguard exhibition (26 June- 31 October 2021) as an example, FOH staff reported a significant proportion of visitors being younger men. But survey results didn’t reflect this, and instead showed that 64.7% of visitors were women whilst 44.9% of visitors were aged 35-54 as can be seen in the images below.
Differences in museum visits by gender are not uncommon, with women being more likely to visit general and natural history museums. But the proportion of Vanguard’s female visitors seemed particularly large, making us believe that our data collection methods may be causing sampling or non-response biases. One theory we had for the large gender difference in Vanguard visitors was that the (ESCS) are only emailed to the person who booked the museum tickets, which may be more likely to be women as a result of gendered divisions of domestic labour. With this in mind, we identified potential issues that our data collection methods may have.
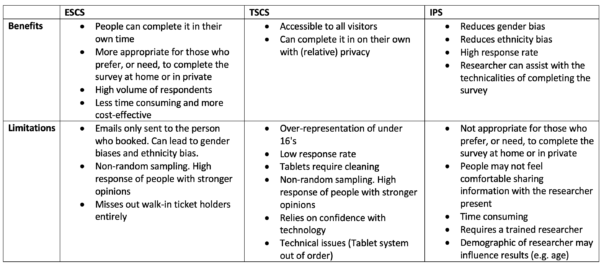
Issues with the emailed self-completion survey (ESCS):
- The email is only sent to the booking email address. This can be problematic as certain demographics are more likely to book tickets on behalf of a group, such as women.
- Busier people may be missed out.
- Some people don’t check their emails.
- The email may go to spam.
- The email is only in one language (English).
- Misses out walk-in ticket holders entirely.
Issues with the tablet self-completion survey (TSCS):
- It attracts a younger demographic.
- Relies on confidence with technology which may miss out certain groups.
- The positioning of the Ipads may affect who is filling the surveys out.
Coming up with a plan
To identify any sampling and non-response biases within our current data collection methods, we decided to conduct an in-person survey (IPS) at both BMAG and Mshed. This would enable more sampling controllability to make the data set as random and unbiased as possible which could then be compared to ESCS and TSCS data gathered at the same time period in order to reveal any differences and identify biases
As we were focusing on sample demographics, we only needed to collect information about people’s age, sex, ethnicity, disability status and postcode so we took this section from the current visitor survey to create a 1 minute IPS.
Collecting the data
After having a walk around the BMAG and MSHED sites I decided on specific locations for the data collection that had a consistent flow of visitors. For BMAG this was on the first floor at the dinosaur area and for MSHED it was the 1st floor main foyer area. This allowed me to catch visitors going up and down the stairs to a range of exhibitions. I also took some Covid-19 safety measures as advised by the Market Research Society’s (MRS) Post-Lockdown Covid-19 guidance regarding undertaking safe face-to-face data collection, which included precautions adhering to social distancing (including only myself touching the iPad) wearing a mask, taking a daily lateral flow test and not approaching those who looked particularly vulnerable. In terms of sampling, I used random sampling by approaching people at regular intervals depending on how busy the museums were such as every 3rd person/ group that passed by. By the end of the data collection process I had come to terms with how awkward and brutal rejections could be however the overall response rate was actually quite high. While MSHED had a response rate of 70%, BMAG had a response rate of 58% which is slightly higher than the average of 57% for IPS. A large number of people were apprehensive about the duration of the survey however agreed to take part once they were reassured it wouldn’t last more than 2 minutes. After they said yes, I read out a a few sentences about what kind of questions would be asked and how their data would be used and stored safely in order to get their informed consent. It’s also important to mention that when approaching a group, I selected one person at random by asking whose birthday was soonest. Asking the actual survey questions usually went smoothly and respondents seemed to find it easy to answer the questions, with me verbally asking the questions and then filling out their responses on an iPad. However a handful of people appeared uncomfortable or confused by the Gender and Ethnicity questions specifically, but not to any major extent. A minority of people were also uncomfortable providing their postcode, with some citing privacy and data sharing issues as a concern. Overall it was a good experience and some were even keen to share their opinions about the museum or have a chat afterwards.
What did we find?
When analysing the findings, we compared the IPS data that was collected from 01/03/22- 19/03/22 with combined ESCS and TSCS data ,collectively referred to as ‘audience finder surveys’ or ‘audience base’, from 01/03/22- 24/03/22, adding an extra 3 days to give people time to complete the ESCS.
Gender
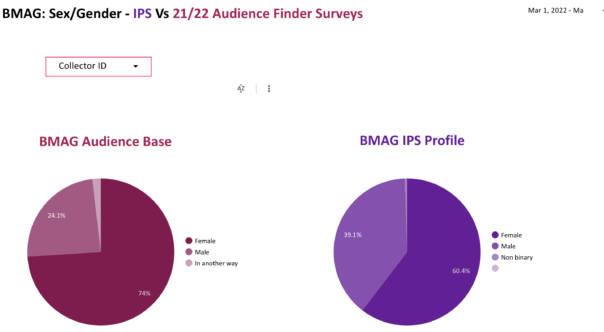
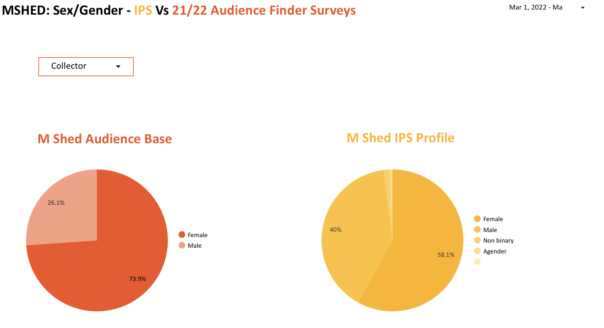
As mentioned, the over representation of women was something that we were particularly aware of from FOH accounts. Our findings indicate that this may in fact be the case. For BMAG, the IPS recorded 13.4% less women than the audience base. Similar results were found at MSHED, with the IPS showing 15.8% less female visitors.
Such gender differences suggest that ESCS and TSCS data collection methods may indeed be leading to an over representation of women. As mentioned previously, this difference could be due to women being more likely to book museum tickets, and thus receive the ESCS. Research has also found that women are more likely than men to engage with and complete E-surveys in general. It is also important to note that, for the IPS at both sites, women still make up over half of visitors. This can be explained by women generally being more likely to visit art galleries and natural histories museums then men, with the figures of 60.4% and 58.1% closely aligning with a broad survey of European museums that found 56%-58% of visitors were female.
Age
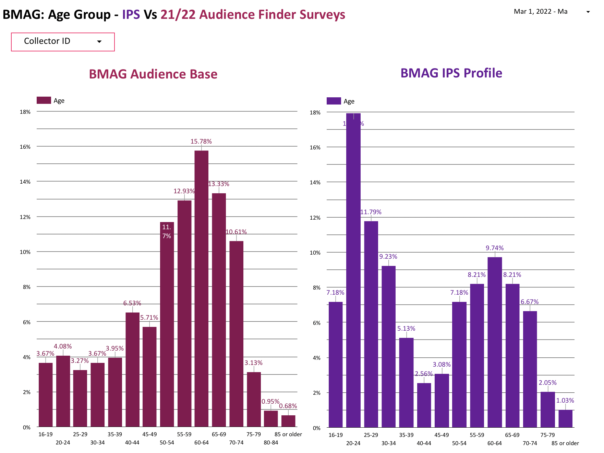
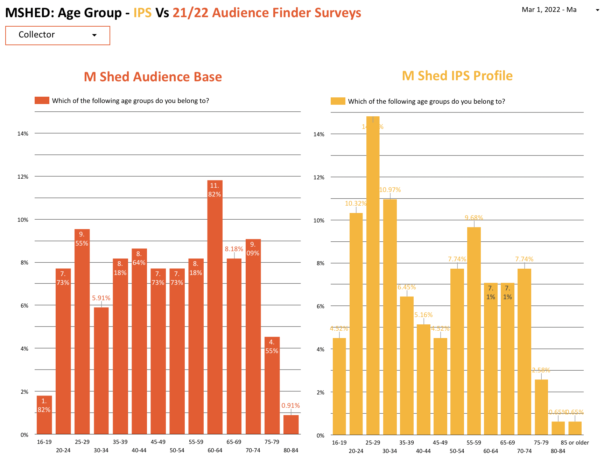
Unexpectedly, some differences in age were found. At both sites, A higher percentage of 16-34 year olds were recorded with the IPS, with other age groups showing a similar pattern to the audience base.
This may indicate that younger age groups are being underrepresented by the ESCS and TSCS and also suggests that young people may have a lower online response rate than elderly populations. However it is important to recognise how my presence as a 23 year old researcher may have affected such results, despite random sampling being consistently used. In this sense, people of my age group could have felt more inclined to complete the survey as they see themselves reflected in my position. With this in mind, it would be useful to repeat the survey with a researcher of a completely different socio-demographic to see if results differ.
Ethnic Group
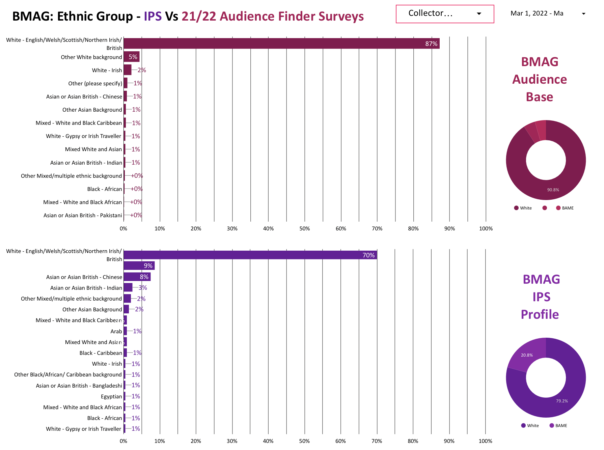
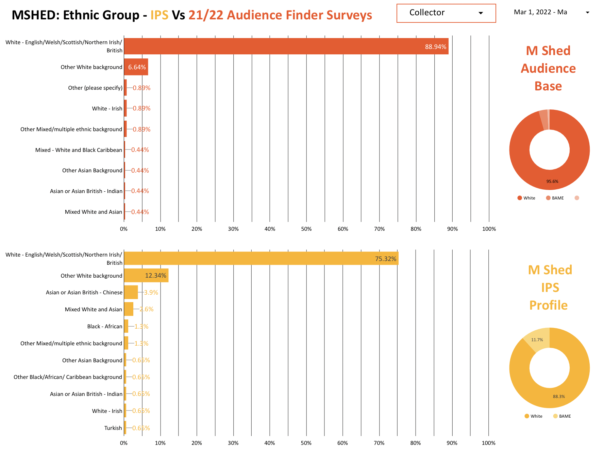
Slight differences between ethnic group responses were found, with the IPS reporting a higher percentage of people with an ‘Other white background’ and ‘Asian or Asian British- Chinese’.
Anecdotally, this may be explained by people not being confident in English or believing they weren’t eligible for the survey. Some of the people stated that their English ability was not that good, a large proportion of whom were Asian or Asian British Chinese. However, most agreed to take part when I convinced them that the survey was very short and simple. This shows that a lack of English ability may prevent certain people or groups from filling out the ESCS and TSCS, implying that surveys in additional languages may be beneficial. Additionally, those who were from an ‘Other White background’ were often tourists and a handful of people mentioned that they didn’t think they were ‘the right people’ to complete the survey because they weren’t British.
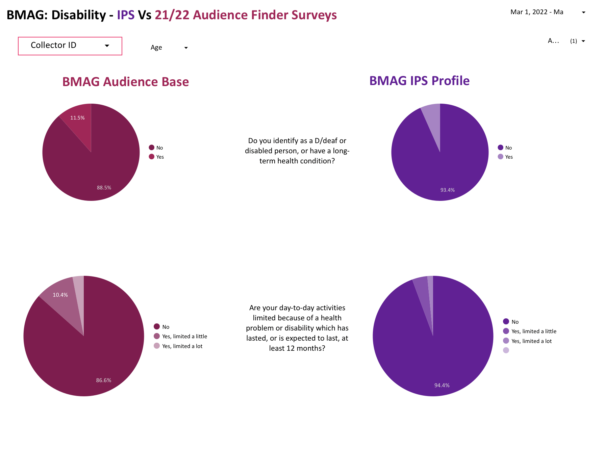
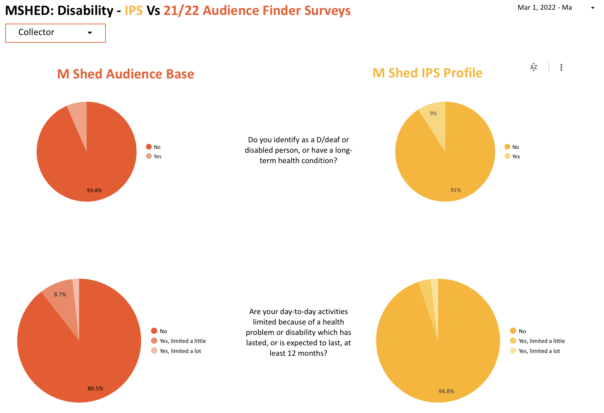
Disability
For those identifying as deaf or disabled or having a long-term health condition, very little difference was found between the audience base and the IPS. However, the second question ‘Are your day-to-day activities limited because of a health problem or disability which has lasted, or is expected to last, at least 12 months?’ did show some differences. The BMAG audience base showed that 13.4% of respondents were limited in some way as opposed to 5.6% reported by the IPS. Similarly, the MSHED audience base showed 10.4% of respondents were limited in some way in contrast to 5.1% as shown by the IPS.
This suggests that the IPS may not be appropriate for gathering data about disabilities and health conditions. Firstly, I was located by a set of stairs which may have missed out those who have to take the lift due to their disability or health condition. Secondly, people may not have been comfortable sharing their personal health information with me but would be more comfortable doing so in private using the ESCS. Thirdly, those with disabilities may need a certain environment or equipment that can only be provided at home in order to complete surveys. Finally, those with particularly evident disabilities were not approached due to covid-19 precautions.
Visitor Locations
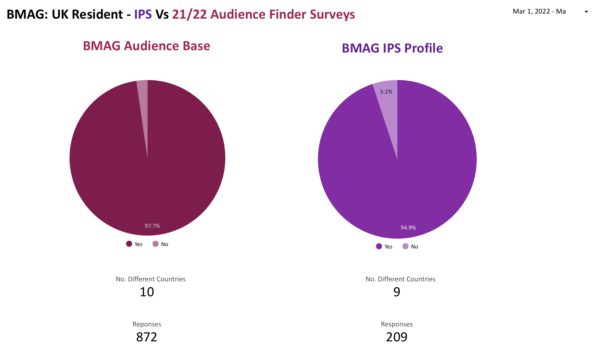
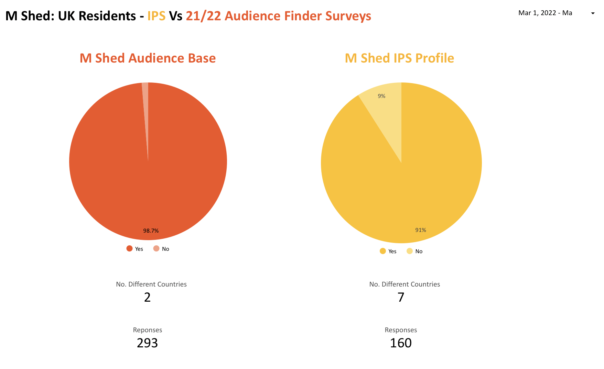
In terms of UK visitors who provided their postcode, no significant difference was found between the audience base and the IPS survey when looking at locations by UK region, region and town/area, suggesting that the ESCS’s and TSCS’s are effective at collecting such information. However when looking at the percentage of non-UK residents there is a significant difference in the responses. For BMAG, the Audience base reported 2.3% of visitors being non-UK residents while the IPS showed this to be 5.1%. Similarly, the audience finder survey at MSHED reported 1.3% of visitors being non-UK residents while the IPS suggested this to be 9%. As I mentioned above, this may be due to tourists not feeling like their English ability was good enough to complete the survey or that they weren’t eligible to complete the survey because they weren’t British.
What do we reccomend?
This project allowed us to see the importance of using multiple data collection methods to collect visitor data and reduce overall bias. It also revealed the benefits and limitations of individual data collection methods :
The key take away from this research is it’s clearly valuable and important to continue doing this research. It appears that our framework for the data collection review worked particularly well being that the IPS had a high response rate and indicated some limitations and benefits of using ESCS and TSCS. It is important to emphasise that future studies should stick to a random sampling method to reduce any bias of IPS. With a bit of confidence and “dedication to the process” the random sampling method of approaching people by intervals worked well alongside selecting someone in a group based on whose birthday was coming up next. In the future, the framework could be expanded into a larger study using volunteer researchers (Watch this space). This would mean that a larger data set could be gathered and multiple locations around the sites could be covered. Ideally, such volunteers would differ in terms of their age, gender and ethnicity in order to reduce any bias that may be caused by the researchers presence. Research could also be extended to the other sites.
Special Thanks to Bristol Museums and the University of Bristol for organising this internship and to Nikita Marryat and Mark Pajak for their support and guidance.