BACKGROUND
Having a visual representation of upcoming exhibitions, works, and major events is important in the exhibition planning process. Rather than relying on spotting dates that clash using lists of data, having a horizontal timeline spread out visually allows for faster cross-checking and helps collaboratively decide on how to plan for exhibition installs and derigs.
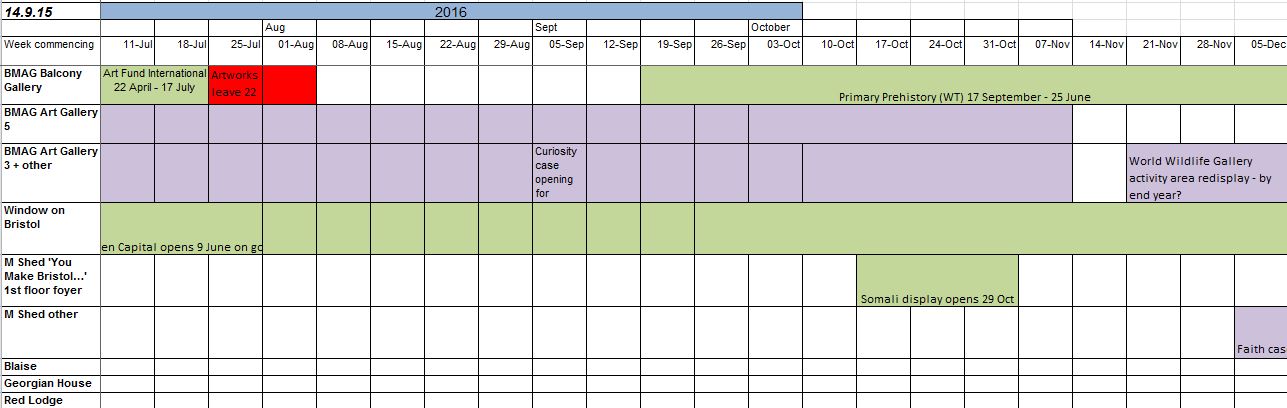
Until recently we had a system that used excel to plan out this timeline, by merging cells and coloring horizontally it was possible to manually construct a timeline. Apart from the pure joy that comes from printing anything from Excel, there were a number of limitations of this method.
- When dates changed the whole thing needed to be rejigged
- Everyone who received a printed copy at meetings stuck that to the wall and so date changes were hard to communicate.
- We need to see the timeline over different scales – short term and long term, so this means using 2 separate excel tabs for each, hence duplication of effort.
- We were unable to apply any permissions
- The data was not interoperable with other systems
TIMELINE SOFTWARE (vis.js)
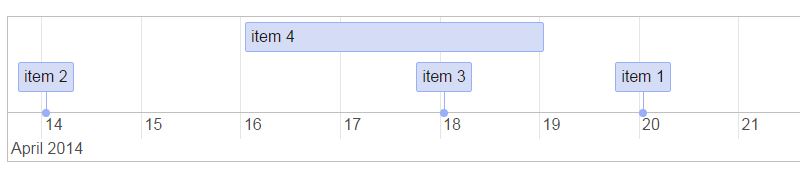
Thanks to Almende B.V. there is an open source timeline code library available at visjs.org/docs/timeline so this offers a neat solution to the manual task of having to recast the timeline using some creative Excel skills each time. We already have a database of Exhibition dates following our digital signage project and so this was the perfect opportunity to reuse this data, which should be the most up to date version of planned events as it is what we display to the public internally in our venues.
IMPLEMENTATION
The digital timeline was implemented using MEAN stack technology and combines data feeds from a variety of sources. In addition to bringing in data for agreed exhibitions, we wanted a flexible way to add installations, derigs, and other notes and so a new database on the node server combines these dates with exhibitions data. We can assign permissions to different user groups using some open source authentication libraries and this means we can now release the timeline for staff not involved in exhibitions, but also let various teams add and edit their own specific timeline data.
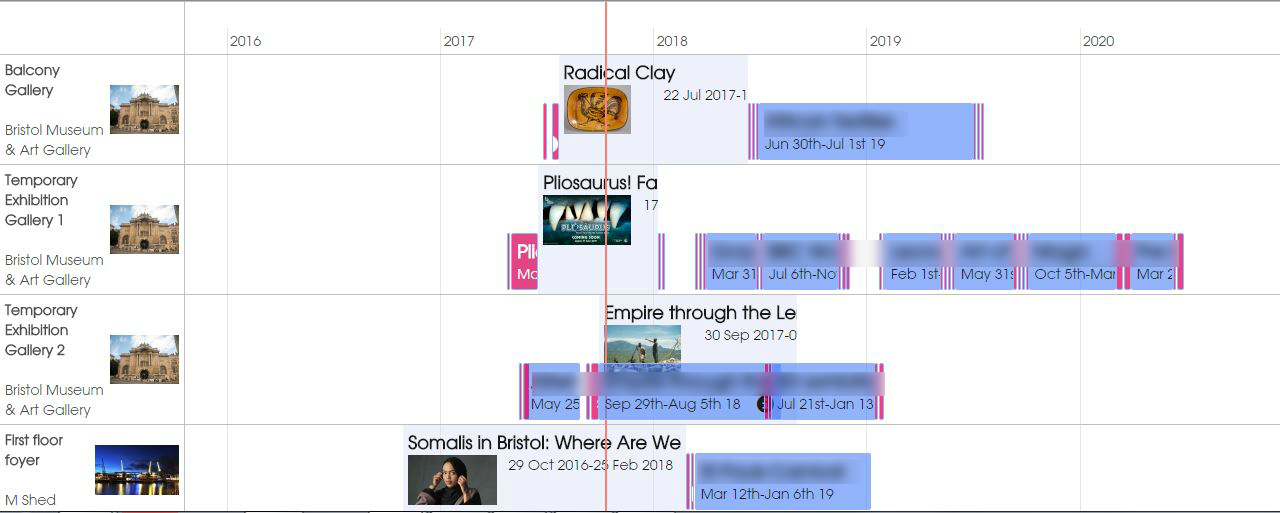
The great thing about vis is the ease of manipulation of the timeline, users are able to zoom in and out, and backward and forwards in time using with mouse, arrow or touch/pinch gestures.
EMU INTEGRATION
The management of information surrounding object conservation, loans and movements is fundamental to successful exhibition development and installation. As such we maintain a record of exhibition dates in EMu, our collections management software. The EMu events module is used to record when exhibitions take place and also the object list where curators select and deselect objects for exhibition. Using the EMU API we are able to extract a structured list of Exhibitions information for publishing to the digital timeline.
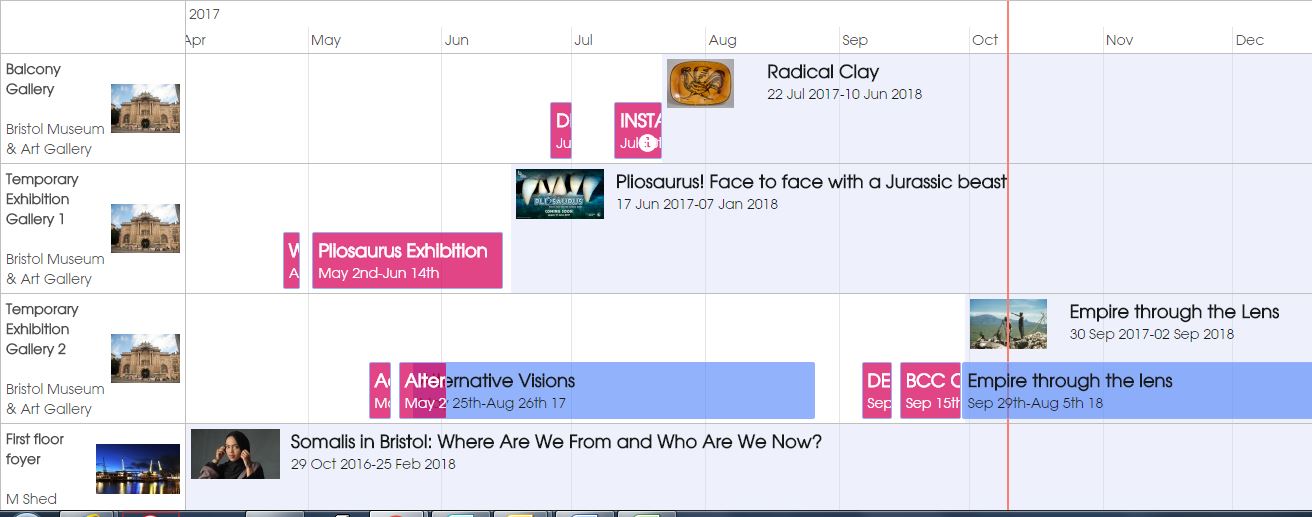
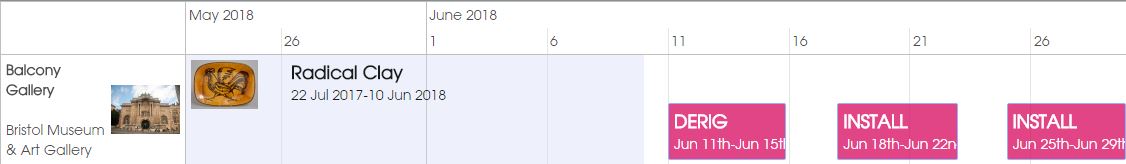
HOW OUR TIMELINE WORKS
Each gallery or public space has its own horizontal track where exhibitions are published as blocks. These are grouped into our 5 museums and archives buildings and can be selected/deselected from the timeline to cross reference each. Once logged in a user is able ot manually add new blocks to the timeline and these are pre-set to “install”, “derig” and “provisional date”. Once a block is added our exhibitions team are able to add notes that are accessible on clicking the block. It is also possible to reorder and adjust dates by clicking and dragging.
IMPACT
The timeline now means everyone has access to an up to date picture of upcoming exhibitons installations to no one is out of date. The timeline is on a public platform and is mobile accessible so staff can access it on the move, in galleries or at home. Less time is spent on creative Excel manipulation and more work on spotting errors. It has also made scheduling meetings more dynamic, allowing better cross referencing and moving to different positions in time. An unexpected effect is that we are spotting more uses for the solution and are currently investigating the use of it for booking rooms and resources. There are some really neat things we can do such as import a data feed from the timeline back into our MS Outlook calendars (“oooooh!”). The addition of thumbnail pictures used to advertise exhibitions has been a favorite feature among staff and really helps give an instant impression of current events, since it reinforces the exhibition branding which people are already familiar with.
ISSUES
It is far from perfect! Several iterations were needed to develop the drag and drop feature fo adding events. Also, we are reaching diminishing returns in terms of performance – with more and more data available to plot, the web app is performing slowly and could do with further optimisation to improve speed. Also due to our IT infrastructure, many staff use Internet Explorer and whilst the timeline works OK, many features are broken on this browser without changes to compatibility and caching settings on IE.
WHAT’S NEXT
Hopefully optimisation will improve performance and then it is full steam ahead with developing our resource booking system using the same framework.
Hi Mark, this is so interesting to read. At ACMI we’ve recently updated our organisational calendar to a better Excel solution than the previous Excel solution. Would you be up for a call so I can ask about your approach?
This is an interesting article, we help in design surveys and collect feedback using mobile forms.