This post is about my recent week of reducing screen time to a minimum after seeking a fresh approach, having lost the plot deep in some troublesome code, overloaded with an email avalanche and pestered by projects going stale. In other words…have you tried turning it off? (and not on again!)
STEP 1: TURN OFF PC
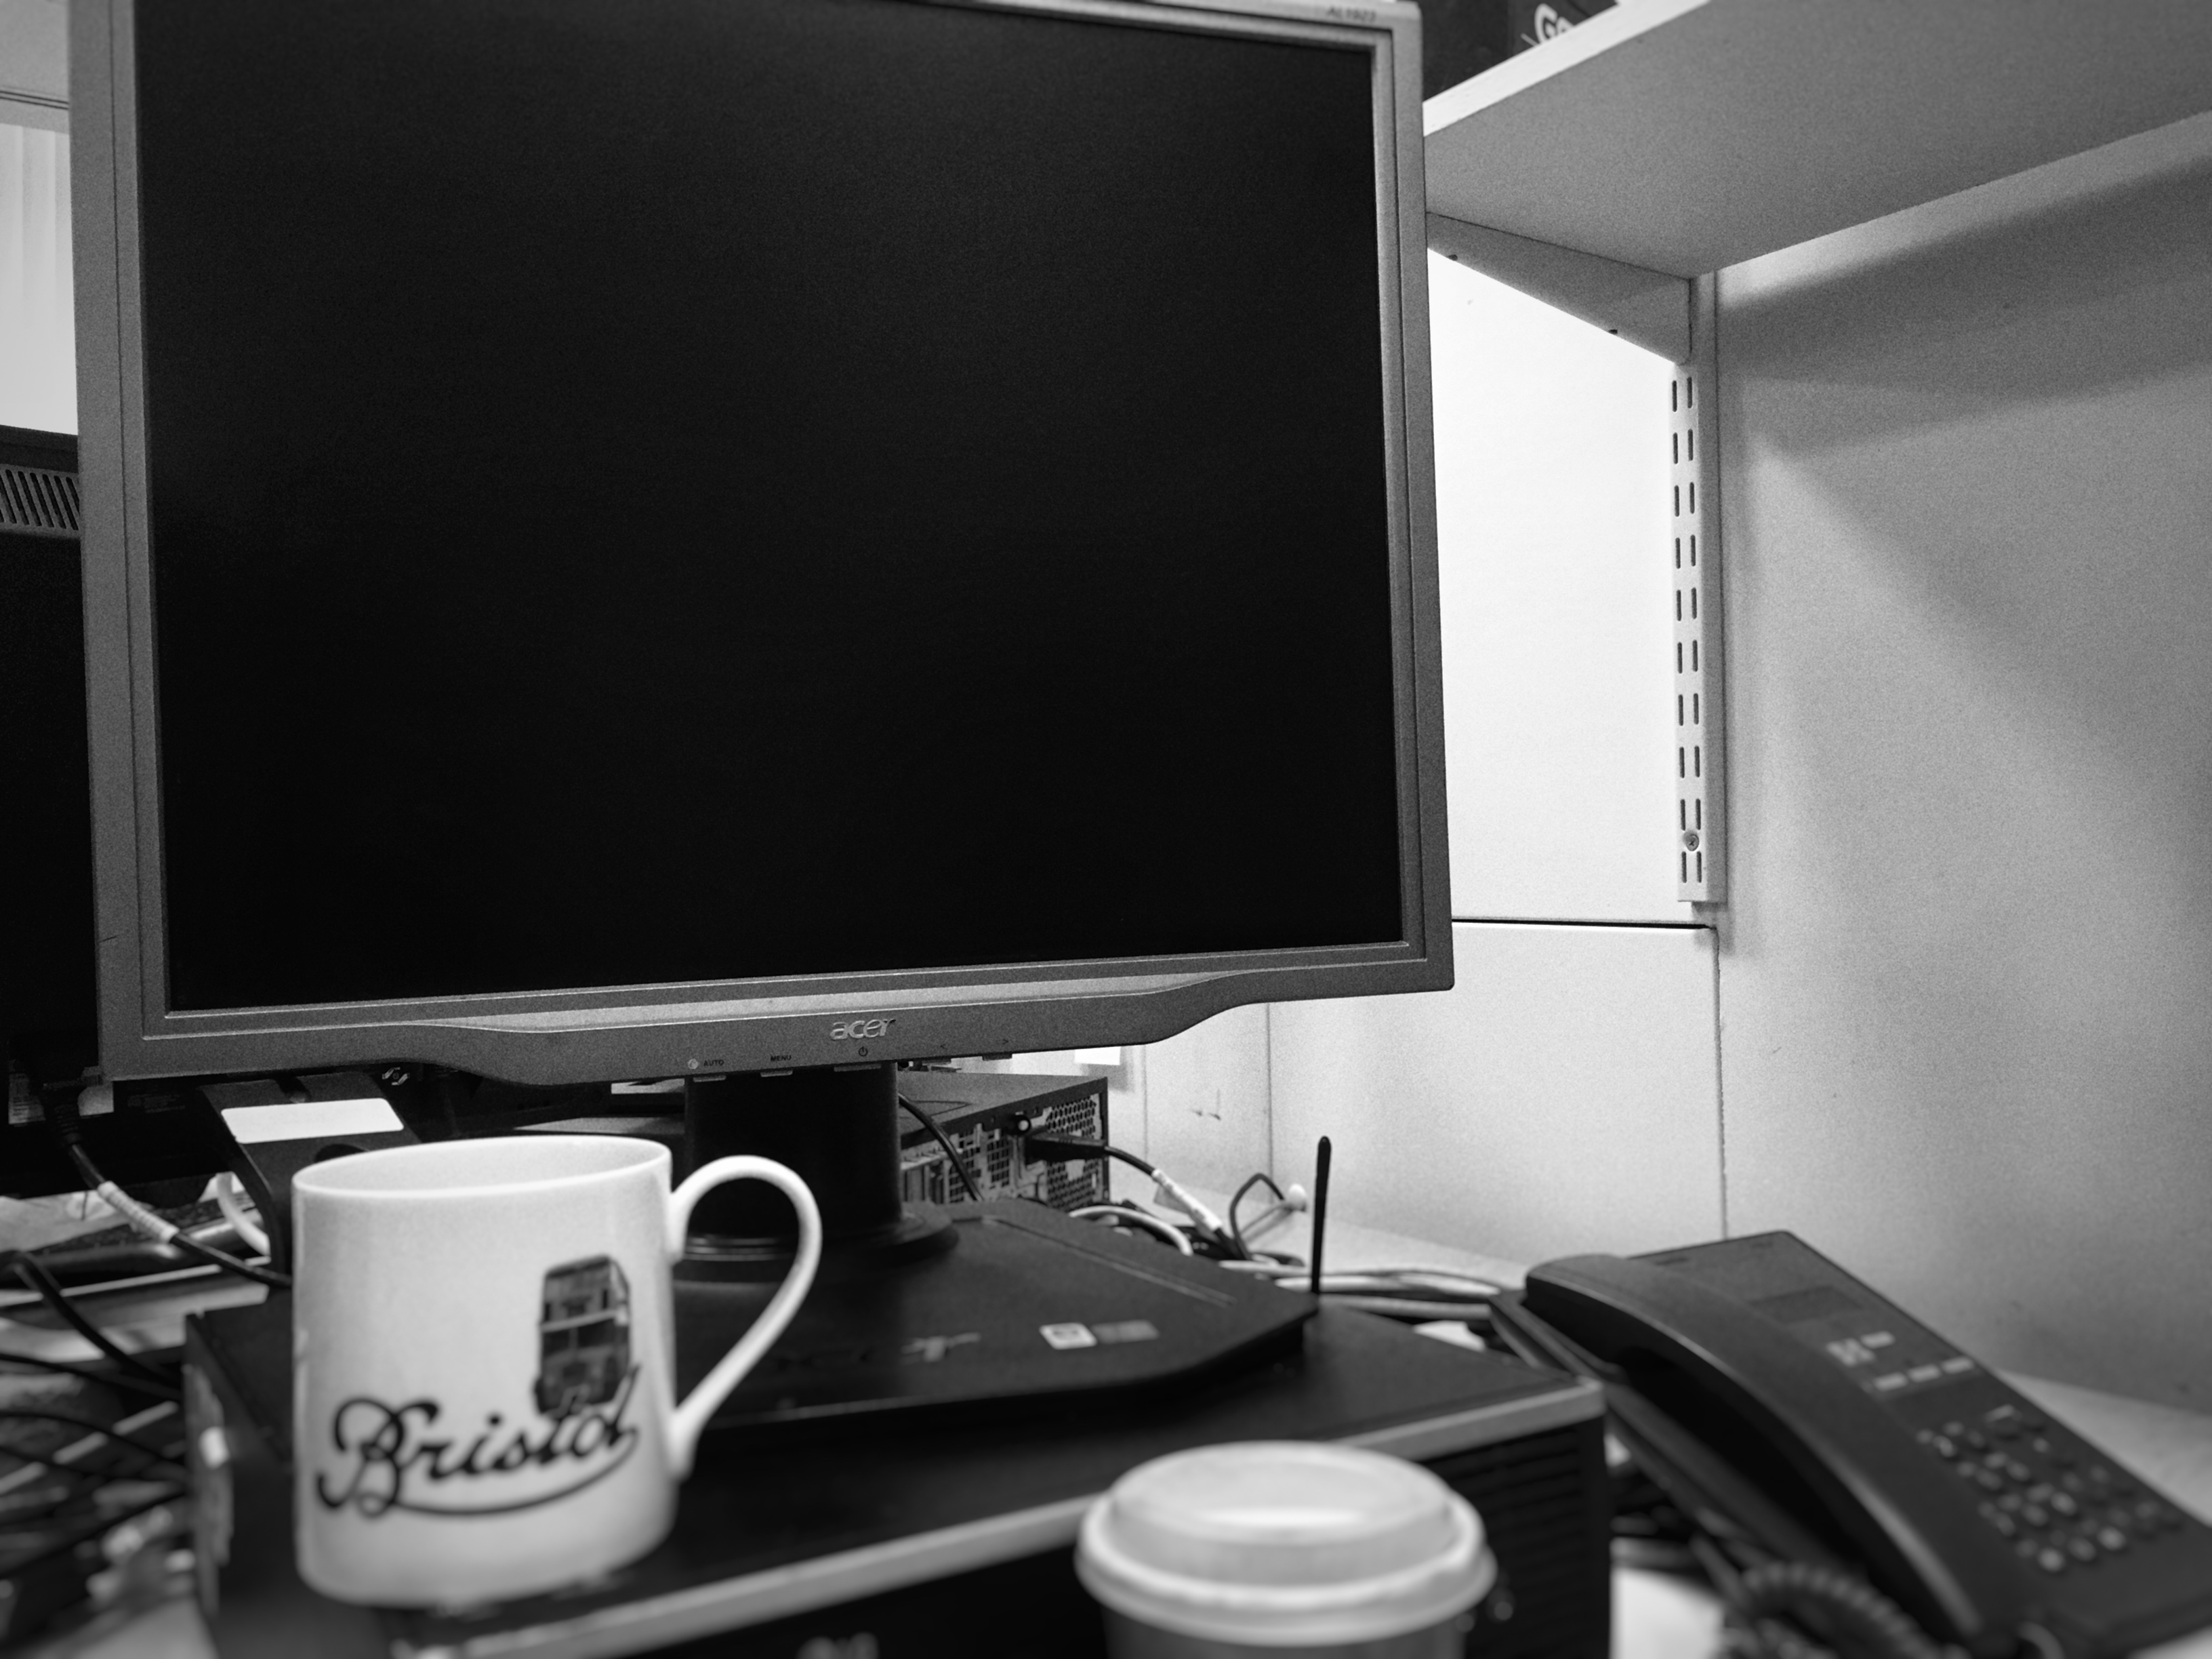
Kinda feels better already. No more spinning cogs, no more broken code, brain starting to think in more creative ways, generally mind feeling lighter. Trip to the stationary cupboard to stock up on Post-its and sticky things, on way speak to a colleague whom I wouldn’t usually encounter and gain an insight into the user facing end of a project I am currently working on (I try to make a mental note of that).
STEP 2: RECAP ON AGILE METHODS
(admittedly you do need to turn the computer back on from here onwards, but you get the idea!)
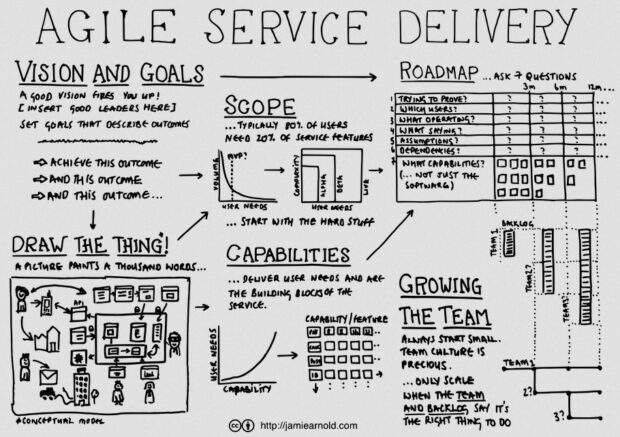
The team here have just completed SCRUM training and we are tasked with scratching our heads over how to translate this to our own working practices. I was particularly inspired by this diagram and blog by Jamie Arnold from G.D.S. explaining how to run projects in an agile way. I am especially prone to wanting to see things in diagrams, and this tends to be suppressed by too much screen time 🙁
“a picture paints a thousand words.”
Also for projects that are stalled or for whatever reason on the backburner – a recap (or even retrospective creation) on the vision and goals can help you remember why they were once on the agenda in the first place, or if they still should be.
STEP 3: FOCUS ON USER NEEDS
It is actually much easier to concentrate on user needs with the computers switched off. Particularly in the museum where immediately outside the office are a tonne of visitors getting on with their lives, interacting with our products and services, for better or worse. Since several of our projects involve large scale transformation of museum technology, mapping out how the user need is acheived from the range of possible technologies is useful. This post on mapping out the value chain explaines one method.
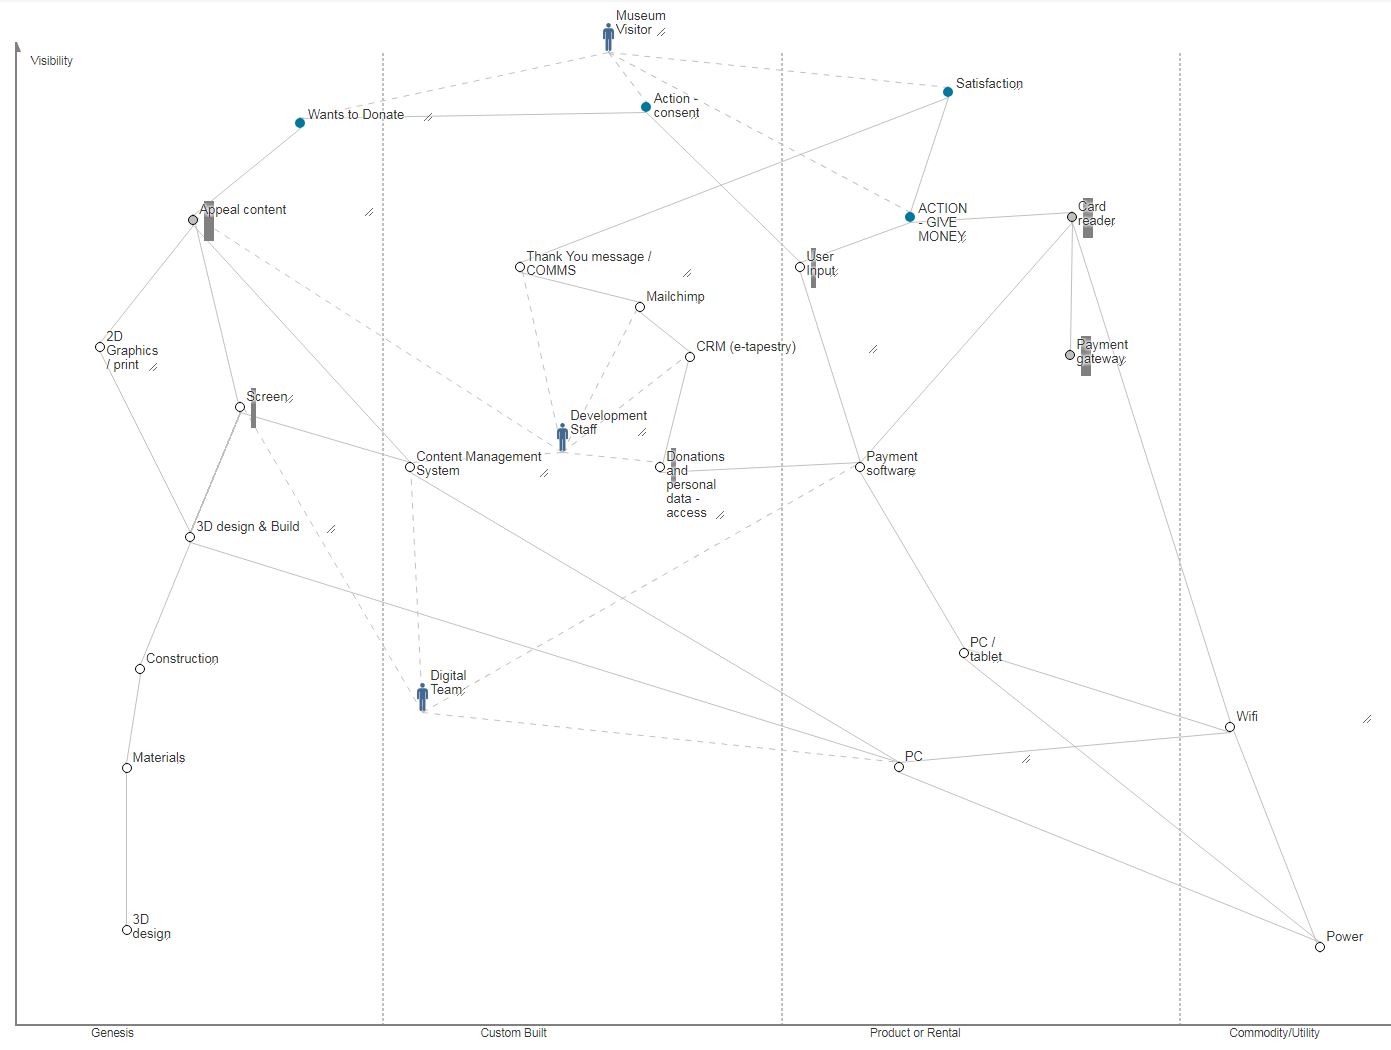
Whilst the resulting spider-web can be intimidating, it certainly helped identify some key dependencies like power and wifi (often overlooked in musuem projects but then causing serious headaches down the line) as well as where extra resource would be needed in developing new services and designs that don’t yet come ‘off the shelf’.
STEP 4: DISCOVERING PRODUCT DISCOVERY
There is almost always one, or more like three of our projects in the discovery phase at any one time, and this video form Teresa Torres on product discovery explains how to take the focus away from features and think more about outcomes, but also how to join the two in a methodical way – testing many solutions at once to analyse different ways of doing things.
We are a small multidisciplinary team, and in that I mean we each need to take on several disciplines at once, from user research, data analysis, coding, system admin, content editing, online shop order fulfilment (yes you heard that right) etc. However, it is always interesting to hear from those who can concentrate on a single line of work. With resources stretched we can waste time going down the wrong route, but we can and do collaborate with others to experiment on new solutions. Our ongoing “student as producer” projects with the University of Bristol have been a great way for us to get insights in this way at low risk whilst helping to upskill a new generation.
STEP 5: GAMIFY THE PROBLEM
Some of the hardest problems are those involving potential conflict between internal teams. These are easier to ignore than fix and therefore won’t get fixed by business as usual, they just linger and manifest, continuing to cause frustration.
Matt Locke explained it elegantly in MCG’s Museums+Tech 2018: the collaborative museum. And this got me thinking about how to attempt to align project teams that run on totally different rhythms and technologies. Last week I probably would have tried to build something in Excel or web-based tech that visualised resources over time, but no, not this week….this week I decided to use ducks!
Shooting ducks on a pinboard turned out to be a much easier way to negotiate resources and was quicker to prototype than any amount of coffee and coding (its also much easier to support 😉 ). It was also clear that Google sheets or project charts weren’t going to cut it for this particular combination of teams because each had its own way of doing things.
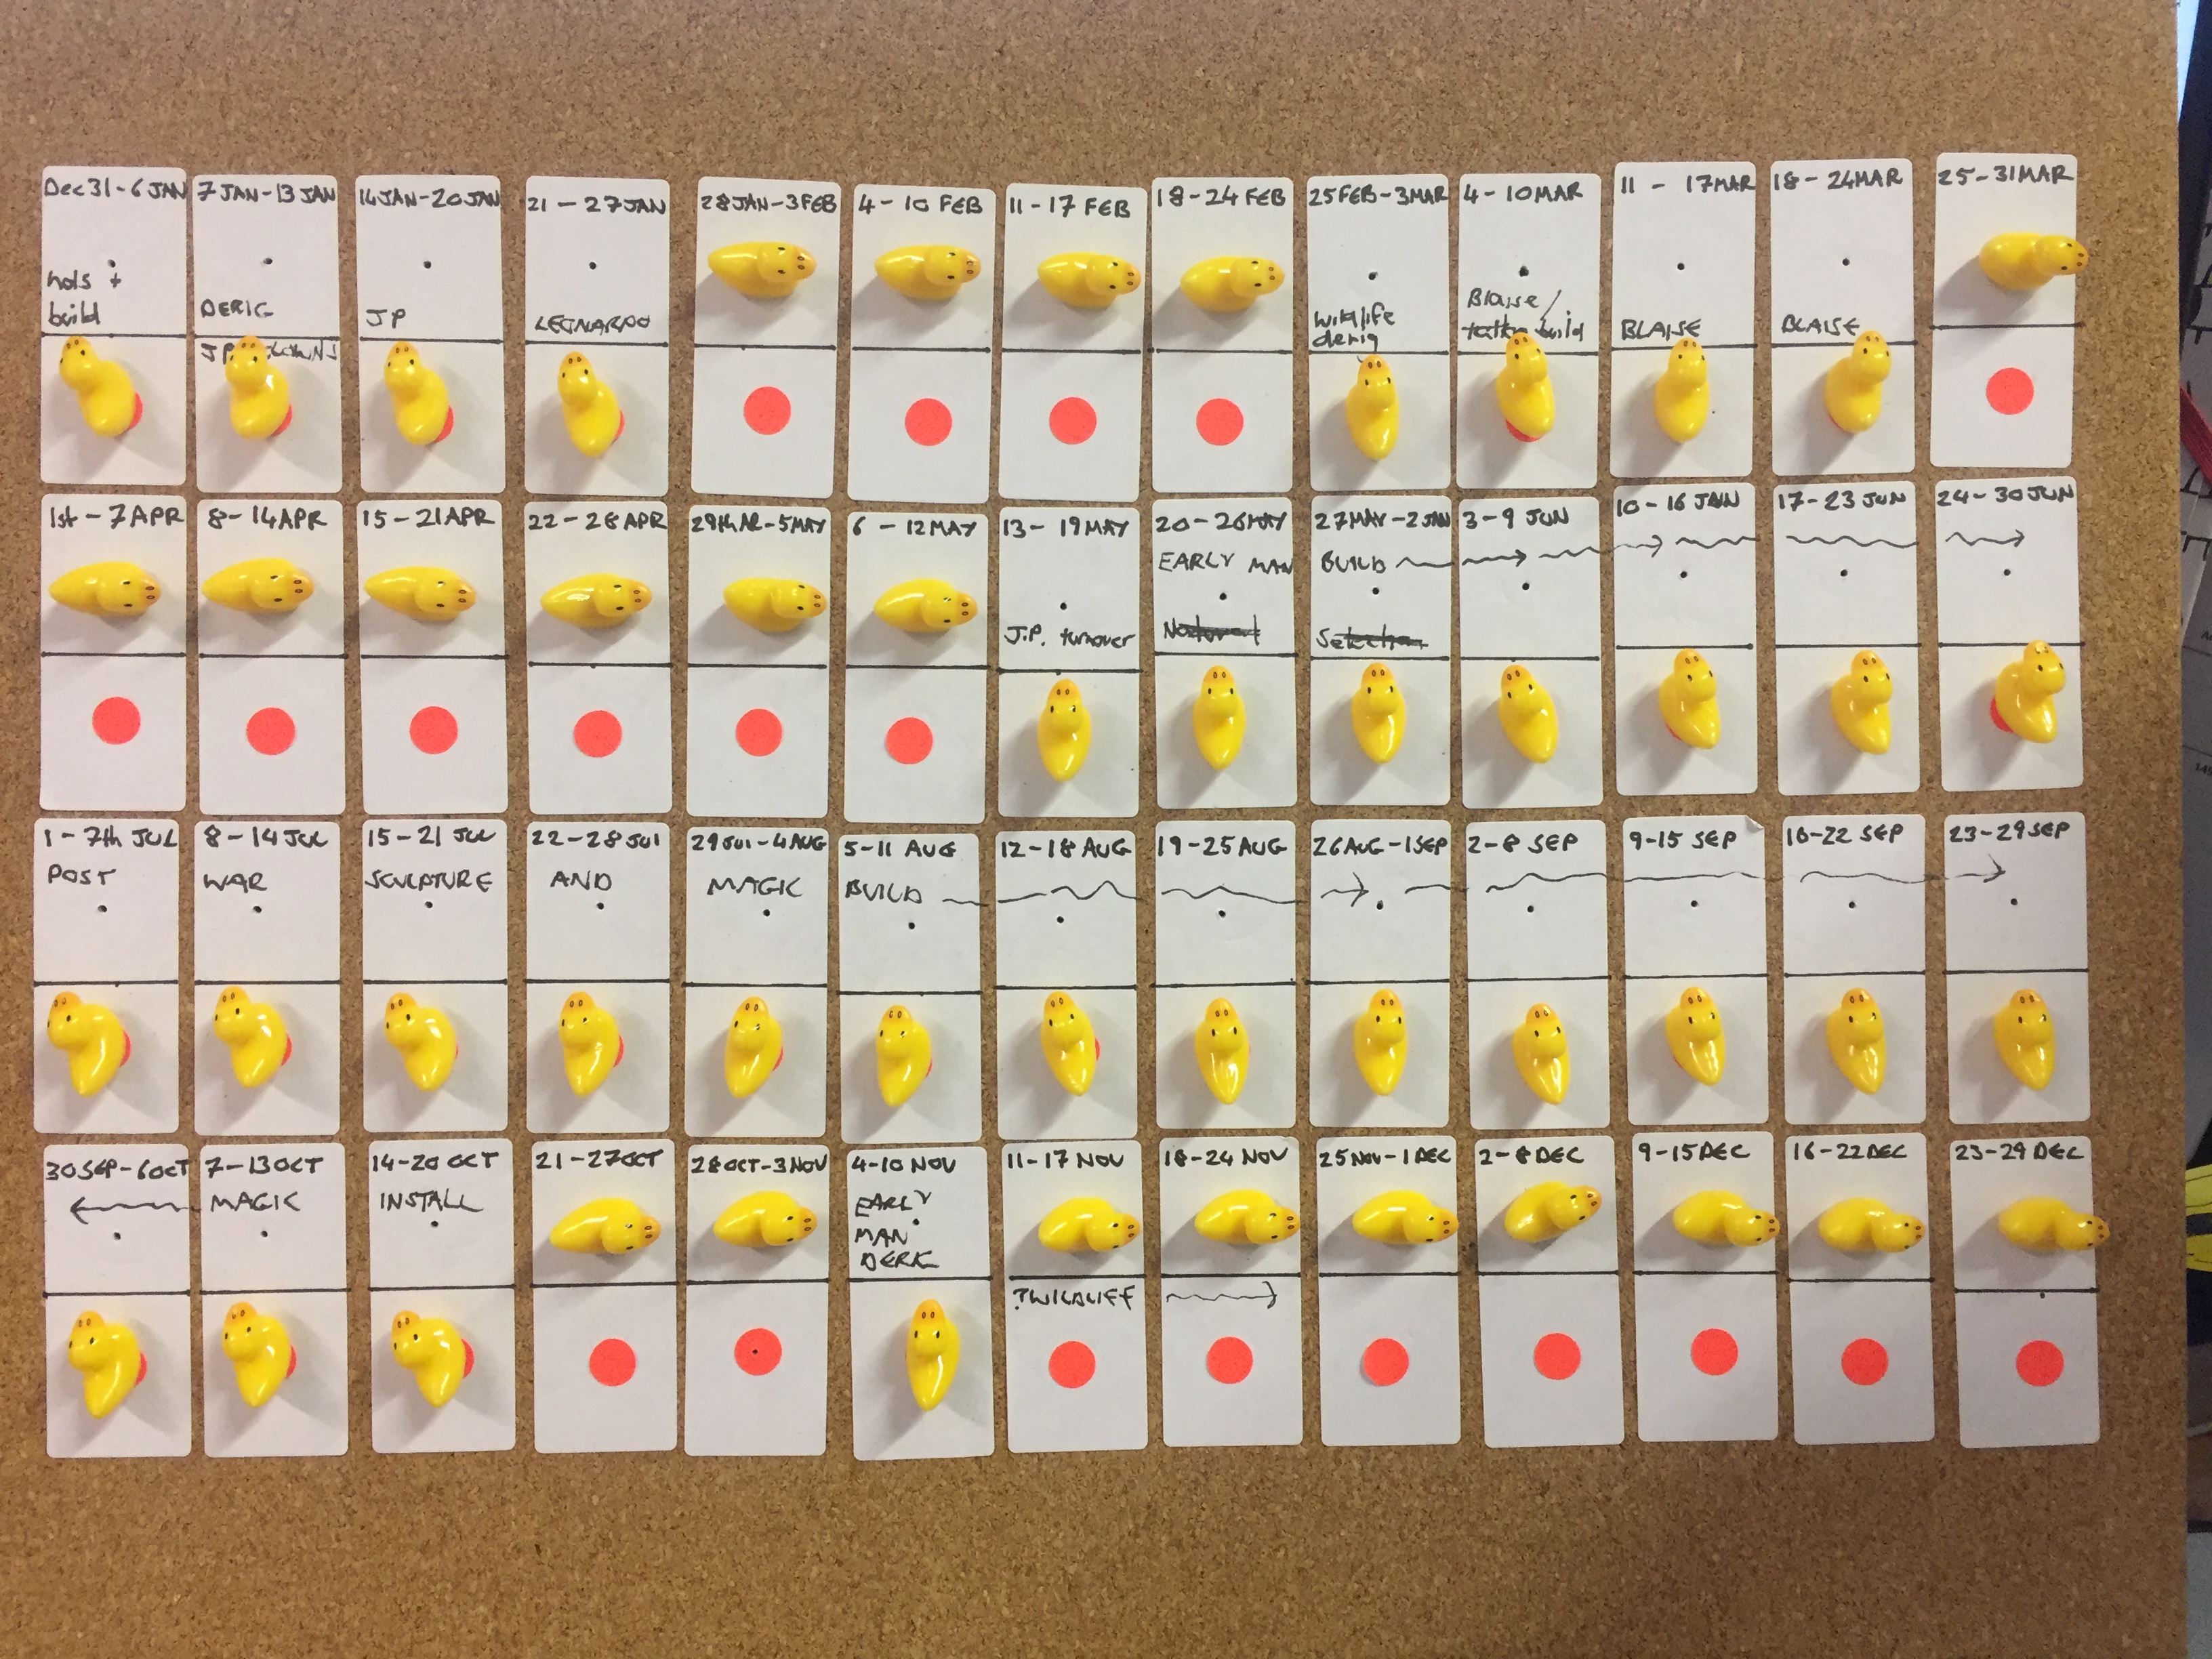
The challenge was to see how many weeks in a year would be available after a team had been booked for known projects. The gap analysis can be done at a glance – we can now discuss the blocks of free time for potential projects and barter for ducks, which is more fun than email crossfire. The problem has now become a physical puzzle where the negative space (illustrated by red dots) is much more apparent than it was by cross-referencing data squares vs calendars. Its also taken out the underlying agendas across departments and helped us all focus on the problem by playing the same game – helping to synchronise our internal rhythms.
REMARKS
It may have come as a surprise for colleagues to see their digital people switch off and reach for analogue tools, kick back with a pen and paper and start sketching or shooting ducks, but to be honest its been one of the most productive weeks in recent times, and we have new ideas about old problems.
Yes, many bugs still linger in the code, but rather than hunting every last one to extinction, with the benefit of a wider awareness of the needs of our users and teams, maybe we just switch things off and concentrate on building what people actually want?