When Colston was toppled on the 7th of June 2020, the Bristol Museum website received a record number of pageviews. In contrast to the lower engagement during prior months of the pandemic, this was pretty striking. Understandably, not many people were checking the museum Opening Times or What’s On pages as museum doors were closed in March 2020 because of coronavirus. However, the digital museum was still ‘open’ – the museum websites are packed with content from Online Collections, Stories, Blog posts and now online events.
My User Research Internship with Bristol Culture was born from a need to analyse how people were engaging with the museum websites throughout the pandemic. Having recently finished my Geography degree at the University of Bristol, where I wrote my dissertation on the inclusivity of gender-neutral toilets in university and art spaces in Bristol, the timing of this internship was perfect. I have always wanted to work in the culture and creative industry, so I was keen to lead this research project.
Google analytics breaks down the user journey into Acquisition, Behaviour and Conversion. I was interested in understanding more about how people found the Museum’s web pages. Acquisition seemed a good place to start the research. Where were audiences coming from: Organic searches? Social Media? Newsletters? This varied across different sections of the website – have a look here.
It was difficult to look at Acquisition alone without making assumptions or querying the Behaviours of these users. How long were they spending on these pages and were there any themes linking the content they were accessing? Next, I explored the Behaviour data collected by Google Analytics.
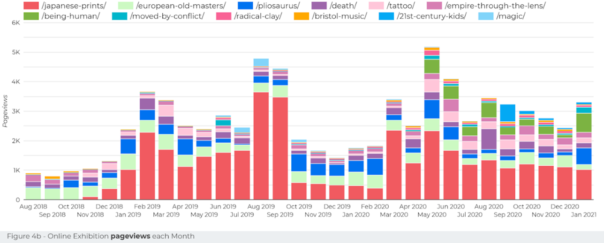
Although users flooded to the website to explore Bristol’s Black British History and involvement in the Transatlantic Slave Trade, a deeper investigation suggested that as Blogs (as opposed to Stories), this content is popular throughout the year.
Online exhibitions showed Japanese exhibits were very popular, but users were dropping off before entering one of the three exhibits. Further testing of the online exhibition platform is needed to analyse the significance of the order the exhibits appear on the homepage. For example, a revolving showreel could be useful here.
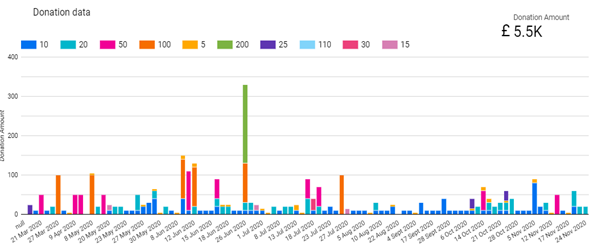
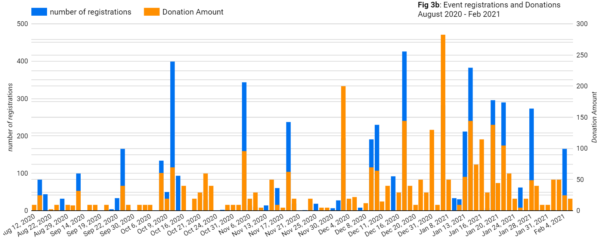
The final stage of my research journey focussed on the relationship between online events and individual donations made. There was another spike in June 2020 with the donations data – this could be related to Colston, online events or a combination, as there were 8 online events in the final 2 weeks of June, some of which sold out. January 2021 was another record high month for donations.
Withstanding everything the pandemic has thrown at the Arts, Bristol Museums have delivered a hugely ambitious online programme of week-long festivals, workshops, lectures and events. In total, there have been 120 events in the past 12 months. A highlight of mine was the panel discussion on the history of gender segregation in sport during the LGBTQ+ History month, because the voices of trans athletes are so often ignored. This blended data suggests that there is a relationship between online event dates and donations.
Leaving Bristol Culture will be sad as I feel like I’ve only just scratched the surface with user research and the possibilities of Google Data Studio. As with much of coding, I had a love-hate relationship with Google Data Studio as it was often challenging to communicate how I wanted to display data using this tool.
I am coming away from the internship with a constant curiosity about the data collected by all other websites I visit and how my user journey is informing their analytics. From my short 3 months at Bristol Museums (working from home 2 days a week), I’ve improved my quantitative data manipulation and analysis skills, learnt the importance of feedback forms, and how to engage a range of audiences with the museum collections and events, during a pandemic.